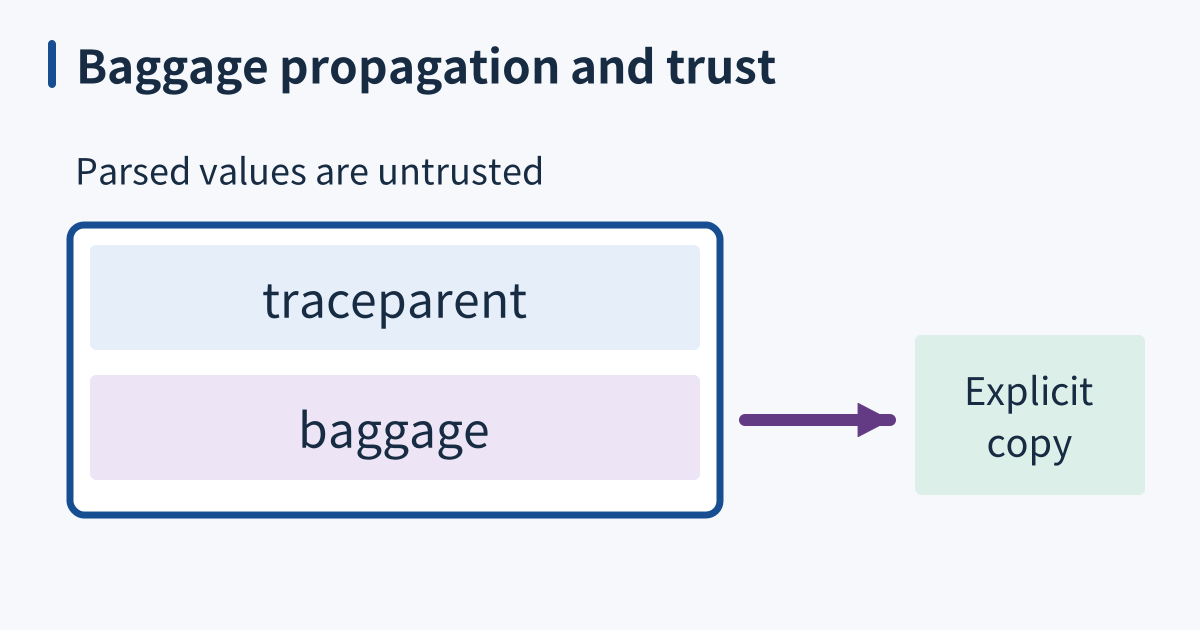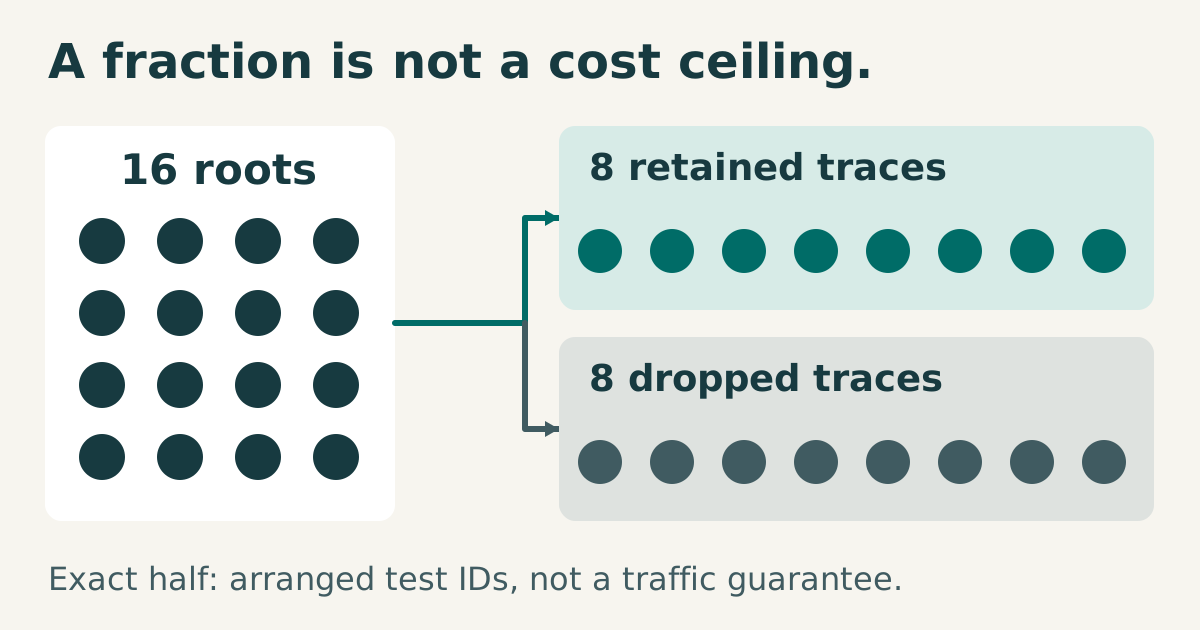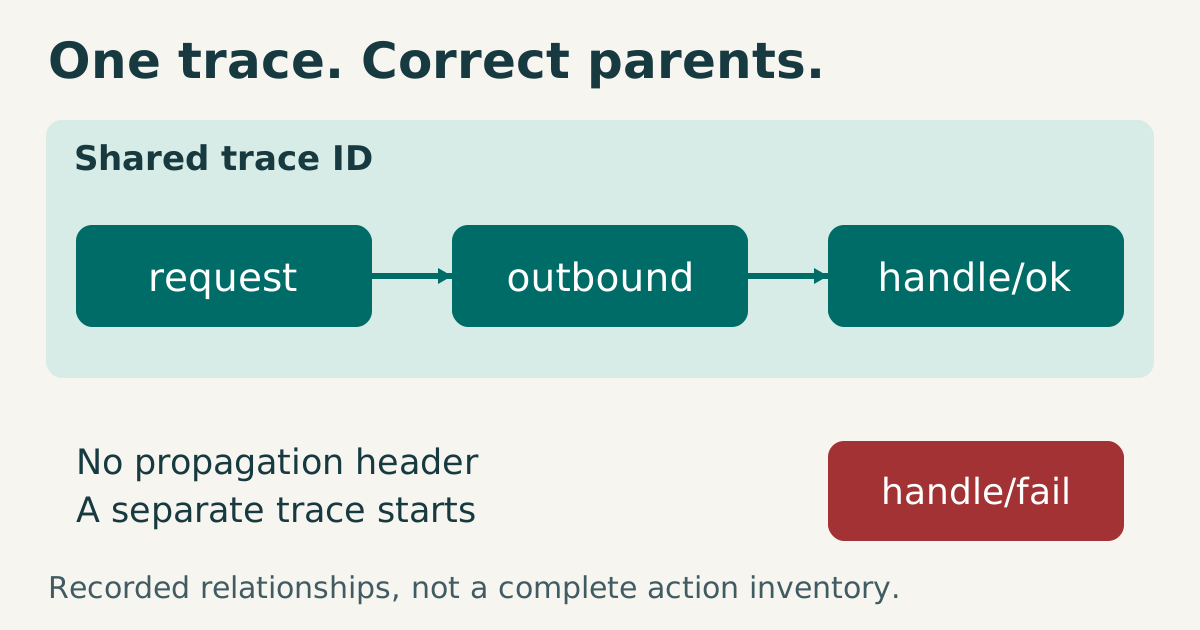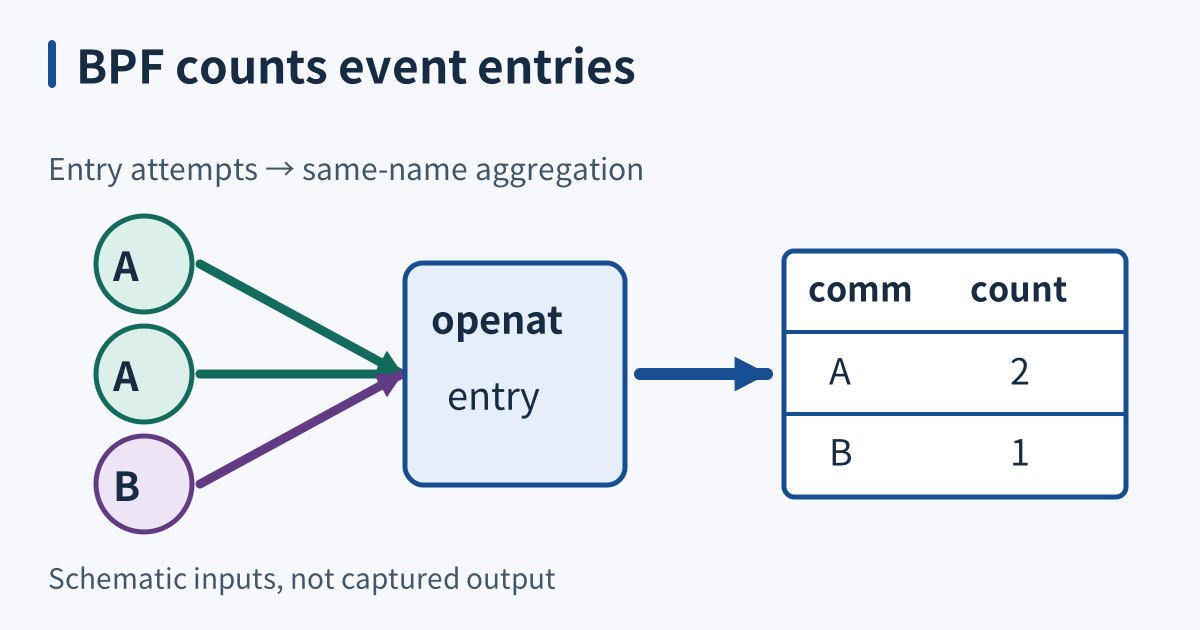
BPF programs can attach to selected events in a running kernel without rebuilding the application or restarting its workload. A userspace loader still loads and manages the probe. Collection changes resource use, so “live” does not mean invisible or free. Other profilers can also observe running programs; choosing BPF depends on the question and available instrumentation.
Define the event, aggregation key, observation interval, and excluded work before interpreting output. A syscall count, a scheduling delay, and a device latency distribution answer different questions. An entry count alone cannot reveal successful operations, time spent waiting, or which storage path served a request.
Probe without pausing
An eBPF program can accumulate counts or histograms in kernel maps while the workload continues. Aggregation reduces userspace output, but every observed event may still execute probe work. The verifier checks program safety under kernel rules; acceptance is not proof of correct measurement, negligible overhead, or an impossible kernel failure.
Start with a bounded question. Counting syscall entries needs an entry event; measuring syscall duration normally requires matching entry and exit state. Block-device latency needs its own event lifecycle. High-level tools such as bpftrace help express these measurements, but a short program does not establish that its units, filters, and correlations are correct.
Tracepoints are named events
Tracepoints expose named kernel events and are often less coupled to implementation details than probes on internal functions. They are not a stable ABI: names and fields can change across kernels. Kprobes can attach by symbol, rather than only by a hardcoded address, but internal function contracts can change too. Pin maintained probes to tested versions.
Inspect the available event and its field format on the intended kernel. A listing establishes visibility, not permission to load and attach a program. If an event is unavailable, record that limitation rather than silently substituting a different event whose count or timing means something else.
Read a histogram, not a firehose
Use aggregation to reveal distributions without printing every event. A latency histogram can suggest fast and slow paths, but its shape is evidence for investigation, not a diagnosis by itself. It cannot establish which path caused an outlier unless the probe measures the relevant distinction. Counts are not latency histograms.
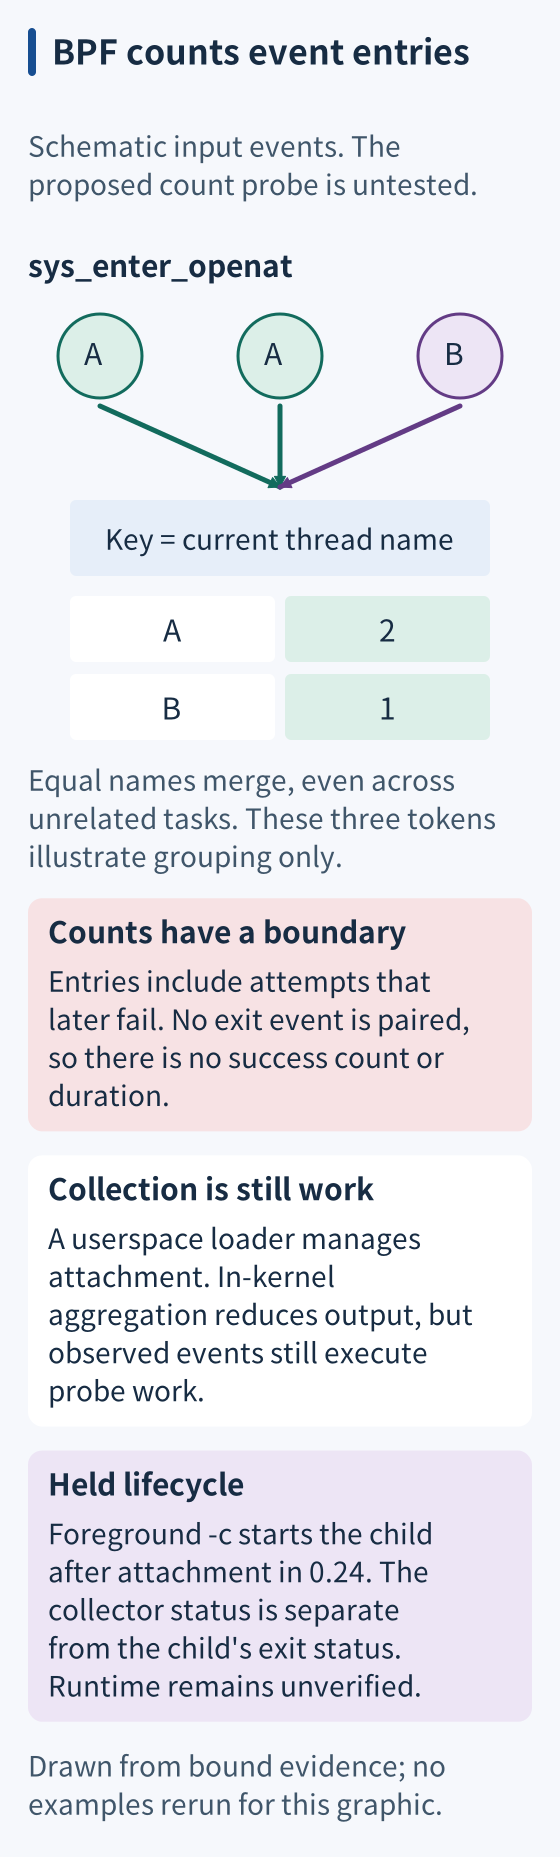
Keep keys deliberate. Grouping by thread name can merge unrelated tasks with the same name; grouping by identifiers or arguments changes cardinality and cost. Apply relevant filters early, bound collection, and preserve the exact probe and workload context when reporting a finding. Compare against independent observations before attributing an application problem to one component.
When it breaks
Loading can fail because of permissions, kernel configuration, unavailable events, or tool-specific BTF or header requirements. Preserve the actual error. Listing tracepoints is not a successful attachment, and absent counts can mean an inactive workload, a mismatched filter, or failed collection. Container access also depends on the host kernel and its security policy; do not weaken protections to force a demonstration.
Hot-path probes can distort the workload even when they aggregate in-kernel. Compare cost under representative conditions and narrow collection when needed. Changing a filter can change the population itself, so a different distribution is not automatically proof that the cheaper observation is more accurate.
Check it quickly
This proposed foreground fixture targets bpftrace 0.24 and an already authorized host; it was not run here. Confirm that version, the exact tracepoint, and /bin/cat before continuing. Keep the evidence directory, stderr and status; do not add privileges to make it pass.
(
  work=$(mktemp -d) || exit 1
  printf 'Evidence directory: %s\n' "$work"
  cd "$work" || exit 1
  printf 'controlled input\n' > input || exit 1
  bpftrace --version || exit $?
  bpftrace -lv 'tracepoint:syscalls:sys_enter_openat' || exit $?
  if bpftrace -o counts.log -c '/bin/cat input' -e '
    tracepoint:syscalls:sys_enter_openat /pid == cpid/ {
      @opens[comm] = count();
    }' > workload.out 2> collector.err; then
    collector_status=0
  else
    collector_status=$?
  fi
  printf 'collector_status=%s\n' "$collector_status"
  cat collector.err
  if [ "$collector_status" -ne 0 ]; then exit "$collector_status"; fi
  cmp input workload.out || exit 1
  cat counts.log
)
In the reviewed 0.24 implementation, -c starts this finite child after probe attachment; pid == cpid restricts the event population. The observation follows the child lifetime, not a ten-second sleep. The child inherits the collector’s privileges. The shell records the collector’s exact foreground status, not the workload’s exit code. cmp checks copied bytes separately; it does not establish that exit code.
Expect entry counts for cat, including startup opens and failed attempts, rather than exactly one successful open. Equal thread names still merge within the selected population. Empty maps or errors are inconclusive. Attachment, shutdown and workload-exit behavior still need a permitted runtime review; source inspection is not execution evidence.
Sources
bpftrace project, project overview and tracing examples, checked 2026-10-18.
eBPF introduction, Official eBPF documentation, checked 2026-06-01.
bpftrace 0.24 language, tracepoint fields and count versus histogram aggregation, checked 2026-10-18.
bpftrace 0.24 standard library, comm identifies the current thread name, checked 2026-10-18.
Linux BPF design Q&A, tracepoint and kprobe attachment is not a stable ABI, checked 2026-10-18.
Linux BPF verifier, verification checks rather than measurement or overhead guarantees, checked 2026-10-18.
GNU Bash manual, wait without an explicit child ID does not return that child’s failure, checked 2026-10-18.
bpftrace 0.24 CLI, child lifetime, privileges, cpid filtering and separate tracing output, checked 2026-10-19.
bpftrace v0.24.0 runtime source, attachment precedes starting the non-USDT child in BPFtrace::run, checked 2026-10-19.