Grafana dashboard variables let one dashboard select an environment, service, or instance without duplicating every panel. A query variable obtains options from a data source; a custom variable can hold a deliberately fixed list. Neither choice is universally better. Use query-backed options when discovery should follow the source, and a maintained static list when the allowed choices are intentionally stable and small.
A variable is substituted into a query before the data source executes it. That makes its formatting part of query correctness. For Prometheus multi-value selections, use a regular-expression label matcher such as environment=~"$environment". Grafana’s Prometheus interpolation handles selected values as regular-expression alternatives with the required escaping. An exact matcher treats the resulting combined text as one label value and therefore does not implement the intended multi-selection. The variable editor’s label_values helper discovers options; it is not a PromQL function to paste into a panel expression.
Check the resulting expression
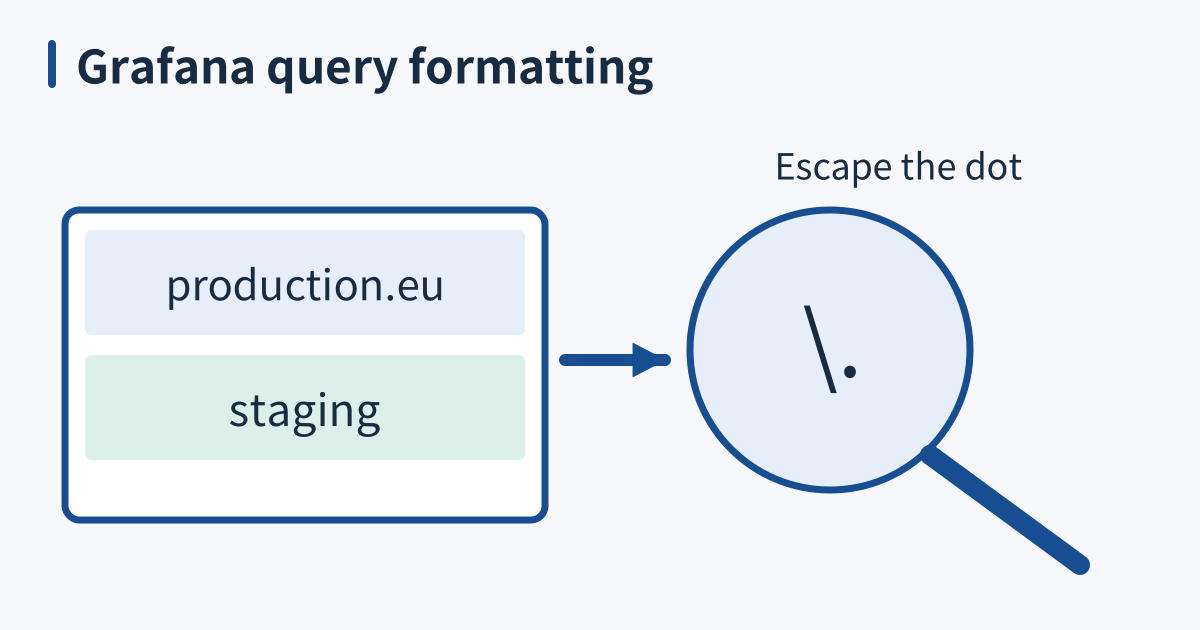
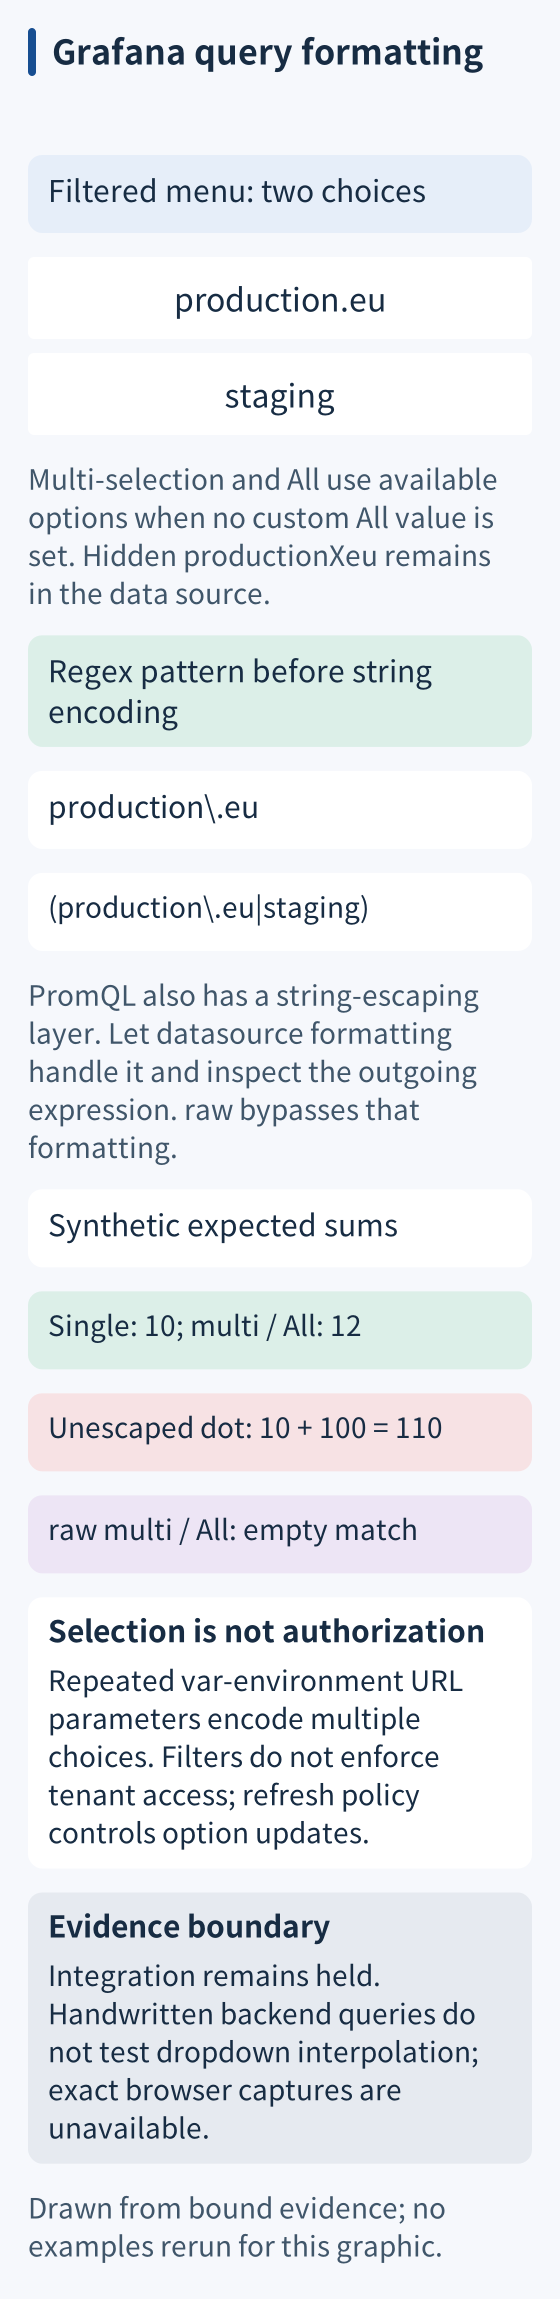
There are two relevant syntactic layers: the regular expression and the PromQL string containing it. A literal dot in production.eu must not become a wildcard that also matches productionXeu. Let the data source’s interpolation perform its documented formatting, and inspect the expression actually sent when using an explicit formatter. The raw formatter bypasses that data-source formatting; it is not a universal fix for difficult variable values.
The All option also has semantics. With no custom All value, this example expands the available, filtered options. Its menu includes production.eu and staging, so All covers those two environments. A custom expression such as .* would instead match whatever values the backend regex admits. Decide whether “all” means the menu’s current choices or a broader query, and test that decision with deliberately excluded data.
When it breaks
Query variables are not guaranteed to stay fresh forever. Their refresh setting determines when Grafana updates the option query, and time-dependent options may need refresh on time-range changes. Chained variables can still produce an empty downstream selection when the data contains no matching combination. Distinguish a legitimately empty result from a stale selection or a broken query before presenting “No data” as a service outage.
Variable filters are not authorization controls. A menu that hides an environment does not remove that environment from the data source or stop another permitted query from requesting it. Enforce access at the appropriate Grafana and backend boundaries. Shared dashboard URLs also carry selections rather than permissions; multiple values use repeated var-environment parameters, not an invented comma-separated permission list.
Check it quickly
Save this as grafana-variables.py. With Python, a local Docker daemon, and both images preloaded, run python3 grafana-variables.py --serve. Disposable Grafana 12.1.0 and Prometheus 3.5.1 containers share a dedicated bridge; only Grafana is published on loopback, without host mounts. Open the printed URL. Serve mode lasts 120 seconds; --serve-seconds accepts 1–300. Control-C enters cleanup and remains an interruption, not normal completion. Docker calls have 30-second timeouts; readiness retries stop after a 20-second deadline plus the in-flight request. Cleanup checks exact owned names and fails on removal, inventory, or command-timeout or in-flight-interruption uncertainty. Without --serve, it checks only handwritten backend queries. Python disables proxy discovery and redirects; browser proxy policy remains a separate prerequisite.
import argparse
import json
import secrets
import subprocess
import time
import uuid
from http.client import HTTPException
from threading import Event
from urllib.error import HTTPError, URLError
from urllib.parse import quote
from urllib.request import HTTPRedirectHandler, ProxyHandler, build_opener

parser = argparse.ArgumentParser()
parser.add_argument("--serve", action="store_true")
parser.add_argument("--serve-seconds", type=int, default=120)
args = parser.parse_args()
if not 1 <= args.serve_seconds <= 300:
    parser.error("--serve-seconds must be between 1 and 300")

def require(condition, message):
    if not condition:
        raise AssertionError(message)

uncertain_commands = []

prefix = "xbcatm-variable-" + uuid.uuid4().hex[:10]
network, prom, grafana = [prefix + suffix for suffix in ("-net", "-prom", "-grafana")]
print(json.dumps({"owned_containers": [grafana, prom], "owned_network": network}), flush=True)


def command(*args):
    try:
        result = subprocess.run(["docker", *args], capture_output=True, text=True, timeout=30)
    except subprocess.TimeoutExpired as error:
        uncertain_commands.append(args)
        raise RuntimeError("Docker " + args[0] + " timed out") from error
    except KeyboardInterrupt:
        uncertain_commands.append(args)
        raise
    if result.returncode:
        raise RuntimeError(result.stderr.strip())
    return result.stdout.strip()


class NoRedirect(HTTPRedirectHandler):
    def redirect_request(self, req, fp, code, msg, headers, newurl):
        raise RuntimeError("Unexpected redirect in local fixture")


opener = build_opener(ProxyHandler({}), NoRedirect())


def get(path):
    with opener.open(origin + path, timeout=5) as response:
        require(response.status == 200, "Unexpected HTTP status")
        return json.load(response)


def eventually(check):
    deadline = time.monotonic() + 20
    while time.monotonic() < deadline:
        try:
            value = check()
            if value:
                return value
        except (HTTPError, URLError, TimeoutError, ConnectionError, HTTPException):
            pass
        time.sleep(0.1)
    raise AssertionError("Local lab did not become ready")


def cleanup_owned(groups):
    # Inspect exact owned names; absence is not inferred from a failed inspect.
    errors = []
    for kind, names, format_string in groups:
        try:
            listing = command(kind, "ls", *( ["--all"] if kind == "container" else [] ),
                              "--format", format_string).splitlines()
            present = sorted(set(names) & set(listing))
            if present:
                command(kind, "rm", *( ["--force"] if kind == "container" else [] ), *present)
        except Exception as error:
            errors.append(f"{kind} removal: {error}")
        try:
            remaining = command(kind, "ls", *( ["--all"] if kind == "container" else [] ),
                                "--format", format_string).splitlines()
            if set(names) & set(remaining):
                errors.append(f"{kind} remains: {sorted(set(names) & set(remaining))}")
        except Exception as error:
            errors.append(f"{kind} inventory unverified: {error}")
    if uncertain_commands:
        errors.append("A Docker command timed out or was interrupted; daemon-side completion remains uncertain")
    require(not errors, "Cleanup not verified: " + "; ".join(errors))
    print(json.dumps({"cleanup": "owned names absent in final inventories"}), flush=True)


source = {"type": "prometheus", "uid": "lab_prom"}
dashboard = {
    "uid": "variable-lab", "title": "Variable escaping lab", "schemaVersion": 41,
    "version": 1, "timezone": "utc", "refresh": "", "time": {"from": "now-5m", "to": "now"},
    "templating": {"list": [{
        "name": "environment", "label": "Environment", "type": "query", "datasource": source,
        "query": {"query": "label_values(lab_active_workers, environment)", "refId": "VariableQuery"},
        "definition": "label_values(lab_active_workers, environment)",
        "regex": "/^(production[.]eu|staging)$/", "refresh": 1, "sort": 1,
        "multi": True, "includeAll": True, "allValue": "", "options": [],
        "current": {"text": ["production.eu"], "value": ["production.eu"], "selected": True},
    }]},
    "panels": [{
        "id": number, "title": title, "type": "stat", "datasource": source,
        "gridPos": {"h": 7, "w": 12, "x": (number - 1) * 12, "y": 0},
        "targets": [{"refId": "A", "expr": expression, "instant": True, "range": False}],
        "options": {"reduceOptions": {"calcs": ["lastNotNull"], "fields": "", "values": False}},
        "fieldConfig": {"defaults": {"decimals": 0}, "overrides": []},
    } for number, title, expression in (
        (1, "Selected workers", 'sum(lab_active_workers{environment=~"$environment"})'),
        (2, "Unescaped control", 'sum(lab_active_workers{environment=~"${environment:raw}"})'),
    )],
}
prom_script = """set -eu
mkdir -p /tmp/www
cat > /tmp/www/metrics.txt <<'METRICS'
# HELP lab_active_workers Synthetic active worker count.
# TYPE lab_active_workers gauge
lab_active_workers{environment="production.eu"} 10
lab_active_workers{environment="staging"} 2
lab_active_workers{environment="productionXeu"} 100
METRICS
cat > /tmp/prom.yml <<'CONFIG'
global:
  scrape_interval: 1s
scrape_configs:
  - job_name: lab
    metrics_path: /metrics.txt
    static_configs:
      - targets: ['127.0.0.1:8080']
CONFIG
/bin/httpd -f -p 127.0.0.1:8080 -h /tmp/www &
exec /bin/prometheus --config.file=/tmp/prom.yml --storage.tsdb.path=/tmp/data
"""
grafana_script = """set -eu
mkdir -p /tmp/data /tmp/provisioning/datasources /tmp/provisioning/dashboards /tmp/dashboards
mkdir -p /tmp/provisioning/plugins /tmp/provisioning/alerting
cat > /tmp/provisioning/datasources/lab.yml <<'DATASOURCE'
apiVersion: 1
datasources:
  - name: Lab Prometheus
    type: prometheus
    uid: lab_prom
    access: proxy
    url: http://metrics:9090
    isDefault: true
    jsonData:
      timeInterval: 1s
DATASOURCE
cat > /tmp/provisioning/dashboards/lab.yml <<'PROVIDER'
apiVersion: 1
providers:
  - name: lab
    type: file
    options:
      path: /tmp/dashboards
PROVIDER
cat > /tmp/dashboards/lab.json <<'DASHBOARD'
""" + json.dumps(dashboard) + """
DASHBOARD
exec /run.sh
"""
try:
    # Use preloaded images; this is a local disposable fixture, not a download step.
    for image in ("prom/prometheus:v3.5.1", "grafana/grafana:12.1.0"):
        command("image", "inspect", image)
    command("network", "create", network)
    command("run", "--pull=never", "-d", "--rm", "--name", prom, "--network", network, "--network-alias", "metrics",
            "--entrypoint", "/bin/sh", "prom/prometheus:v3.5.1", "-c", prom_script)
    command("run", "--pull=never", "-d", "--rm", "--name", grafana, "--network", network,
            "-p", "127.0.0.1::3000", "-e", "GF_PATHS_DATA=/tmp/data",
            "-e", "GF_PATHS_PROVISIONING=/tmp/provisioning",
            "-e", "GF_AUTH_ANONYMOUS_ENABLED=true", "-e", "GF_AUTH_ANONYMOUS_ORG_ROLE=Viewer",
            "-e", "GF_AUTH_DISABLE_LOGIN_FORM=true", "-e", "GF_AUTH_BASIC_ENABLED=false",
            "-e", "GF_SECURITY_ADMIN_PASSWORD=" + secrets.token_urlsafe(24),
            "-e", "GF_ANALYTICS_REPORTING_ENABLED=false", "-e", "GF_ANALYTICS_CHECK_FOR_UPDATES=false",
            "-e", "GF_ANALYTICS_CHECK_FOR_PLUGIN_UPDATES=false", "-e", "GF_PLUGINS_PREINSTALL_DISABLED=true",
            "--entrypoint", "/bin/sh", "grafana/grafana:12.1.0", "-c", grafana_script)
    origin = "http://" + command("port", grafana, "3000/tcp").splitlines()[0]
    health = eventually(lambda: get("/api/health"))
    require(health["version"] == "12.1.0" and health["database"] == "ok", "Unexpected Grafana health")
    loaded = eventually(lambda: get("/api/dashboards/uid/variable-lab"))
    require(loaded["dashboard"]["templating"]["list"][0]["multi"] is True, "Dashboard provisioning mismatch")
    checks = {}
    cases = ((r"production\\.eu", 10), ("staging", 2),
             (r"(production\\.eu|staging)", 12), ("production.eu", 110),
             ("production.eu,staging", None), (".*", 112))
    # Wait for the synthetic series to be scraped before asserting empty results.
    def ready_series():
        result = get("/api/datasources/proxy/uid/lab_prom/api/v1/query?query=" +
                     quote("count(lab_active_workers)", safe=""))["data"]["result"]
        return len(result) == 1 and float(result[0]["value"][1]) == 3
    eventually(ready_series)
    for pattern, expected in cases:
        expression = 'sum(lab_active_workers{environment=~"' + pattern + '"})'
        result = get("/api/datasources/proxy/uid/lab_prom/api/v1/query?query=" +
                     quote(expression, safe=""))["data"]["result"]
        value = None if not result else float(result[0]["value"][1])
        require(len(result) <= 1 and value == expected, (expression, result))
        checks[expression] = value
    print(json.dumps({"app_url": origin + "/d/variable-lab/variable-escaping-lab",
                      "grafana_version": health["version"],
                      "backend_handwritten_query_checks": checks,
                      "dashboard_interpolation": "NOT CHECKED",
                      "serve_seconds": args.serve_seconds if args.serve else 0}), flush=True)
    if args.serve:
        Event().wait(args.serve_seconds)
finally:
    cleanup_owned((("container", (grafana, prom), "{{.Names}}"),
                   ("network", (network,), "{{.Name}}")))
Interrupted or timed-out commands remain uncertain despite empty inventories. Cleanup failures chain the primary exception. Repeated interruption or abrupt death can prevent cleanup; final inventories cannot exclude delayed daemon work or concurrent changes.
Explicit checks remain active under Python optimization. The Python checks submit handwritten PromQL through the data-source proxy; they do not exercise dropdown interpolation. The comma-joined and wildcard controls expect no series and 112 respectively; neither is a dropdown test. The synthetic series hold ten workers for production.eu, two for staging, and one hundred for productionXeu. With only production.eu selected, “Selected workers” must show ten, while the deliberately unescaped control shows one hundred ten. Select both available options, then All: the correct panel must show twelve in each case. The raw control becomes empty because its comma-joined text does not match the intended alternatives.
For each browser selection, retain Query Inspector’s outgoing expression and returned value alongside the displayed selection. Check repeated URL parameters when selecting both values. Backend output explicitly labels dashboard interpolation “NOT CHECKED.” The earlier author reports Chrome 152 checks of these selections and fields. Exact browser captures were not recovered for this review, and neither containers nor browser were rerun. Those historical observations concern the provisioned synthetic dashboard, not tenant isolation or changing-discovery freshness. When adapting the dashboard, keep the excluded environment as a regression case and verify the final expression whenever variable type, formatter, refresh policy, or data source changes.
Sources
Python assert statement, optimization omits assertions and any calls inside them, checked 2026-10-18.
Grafana variables, variable types and dashboard reuse, checked 2026-09-13.
Grafana Prometheus template variables, multi-value regex matching and refresh behavior, checked 2026-09-13.
Grafana variable syntax, data-source interpolation and explicit formatting overrides, checked 2026-09-13.
Grafana dashboard URL variables, repeated URL parameters for multiple selected values, checked 2026-09-13.
Python urllib.request, private opener and disabled automatic proxies, checked 2026-10-19.
Python subprocess, subprocess timeout scope, checked 2026-10-19.