A HorizontalPodAutoscaler turns configured metrics into replica recommendations. Choosing the metric and its aggregation is therefore part of application design. Increasing replicas should reduce the measured pressure or increase useful throughput; otherwise the controller may spend more money without relieving the bottleneck. Set explicit minimum and maximum counts, but do not confuse a cost bound with a performance guarantee.
Separate measurement from control
HPA normally reconciles periodically, with a default controller sync period of fifteen seconds. For per-Pod average targets, its basic calculation is the ceiling of current replicas multiplied by current metric divided by target metric. CPU utilization is relative to resource requests, rather than the CPU limit or the entire node’s capacity.
Averaging across Pods is not the same as averaging a time series. Metrics Server reports CPU usage measured over a window; custom adapters define their own measurement and query semantics. HPA does not universally smooth every input over a configurable measurement window. Tolerance, readiness handling, stabilization, and rate policies are separate controller mechanisms layered around metric recommendations.
Check the unit before the target number. Per-Pod custom metrics use AverageValue; object and external metrics can use Value or AverageValue with different scaling meaning. A total queue depth and an average backlog per replica are not interchangeable. Resource utilization additionally needs the relevant resource requests. An unsuitable metric can return a perfectly valid number while still measuring the wrong bottleneck.
Pick a signal replicas can improve
CPU often works for CPU-bound services, but availability of the resource metrics API is a prerequisite, not a universal cluster property. Workers blocked on a database can have low CPU and high latency. More workers might make the database problem worse. Test whether the chosen target corresponds to sustainable work per replica before relying on autoscaling.
Request rate, in-flight work, and consumer lag each require explicit scope. For a per-Pod metric, expose the necessary per-Pod observations rather than collapsing everything into one workload series. For an object or external signal, aggregate to the intended workload or queue and exclude unrelated traffic. Avoid unnecessary per-user labels that increase adapter query cost and complicate selection.
Give replica ownership one home
HPA reads the target’s scale information and adjusts its replica count. A Deployment’s initial replicas value is not the HPA minimum; minReplicas is the configured floor. Reapplying a manifest that continually writes a fixed replica count can compete with HPA. Arrange configuration ownership deliberately, including what static count should apply if autoscaling is removed.
When it breaks
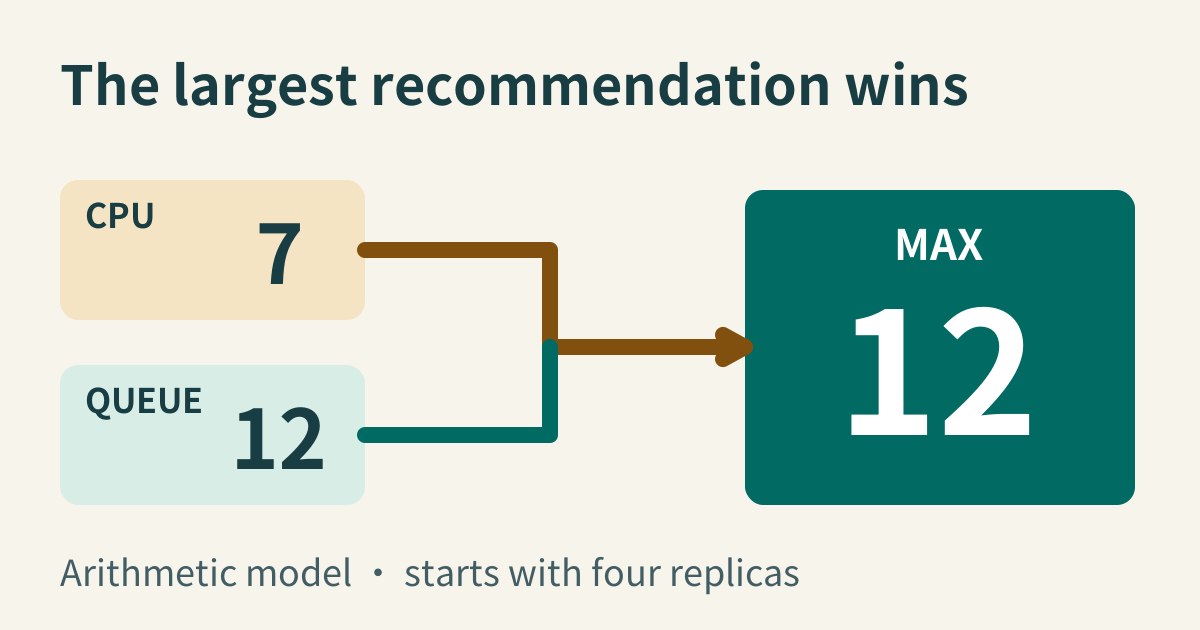
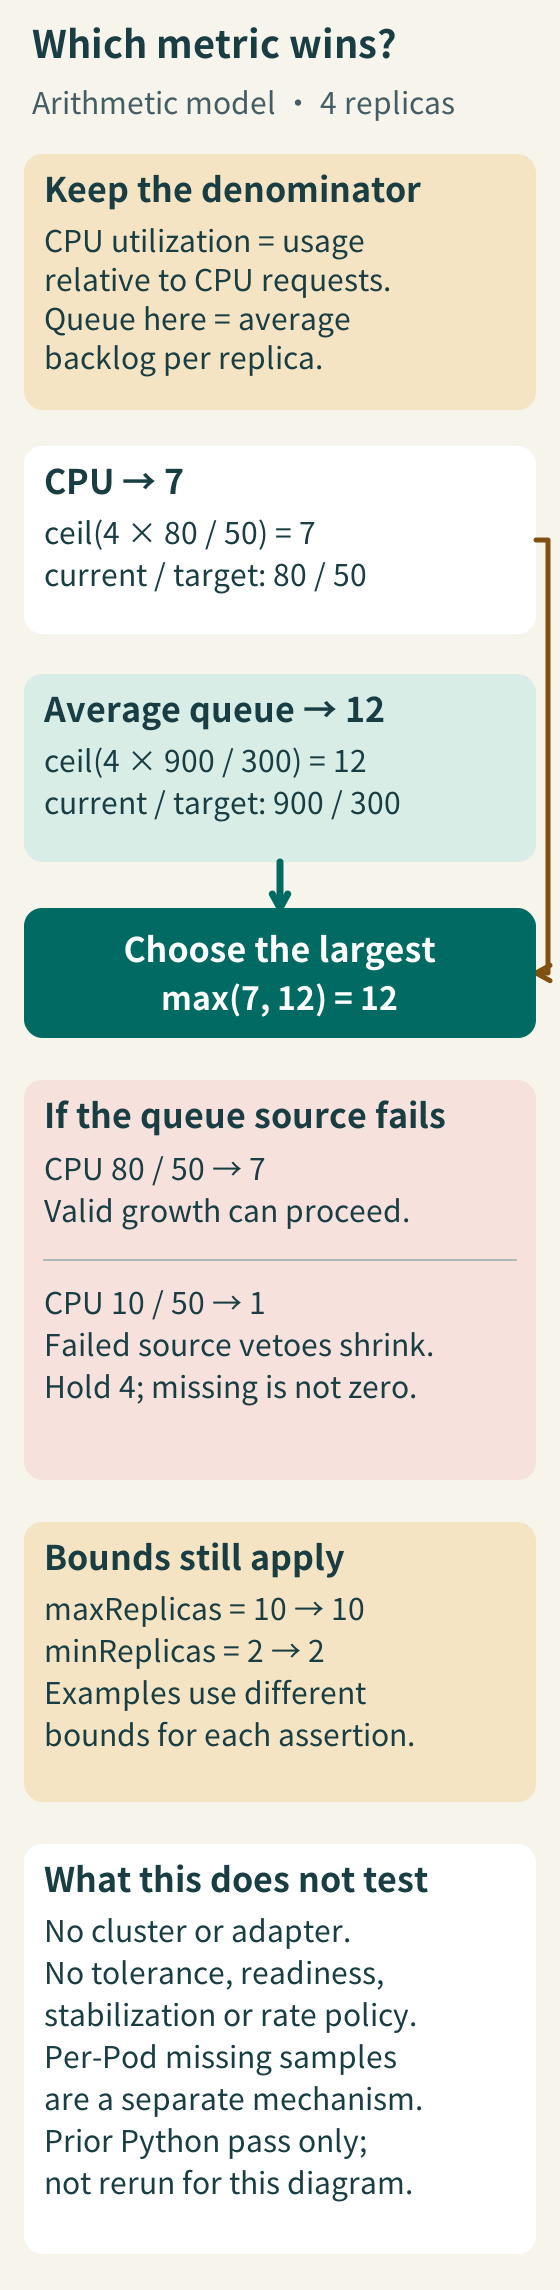
An unavailable custom metric does not automatically fall back to CPU. With multiple configured metrics, HPA chooses the largest usable recommendation. If one metric fails and the usable metrics recommend shrinking, it skips that scale-down. A valid recommendation above the current count can still permit scale-up. Thus explicitly adding CPU offers another input, not unconditional failover in both directions.
Distinguish a failed metric source from missing measurements for individual Pods. The latter also causes conservative adjustments in the resource algorithm. Inspect conditions and events rather than asserting that every missing sample must set ScalingActive=False. Successful readings, failed sources, and current bounds can coexist.
Stale adapter data can drive scaling after the relevant work has drained. Inspect timestamps, query scope, caching, and collection latency before retuning the target. A metric API error and a valid-but-irrelevant memory reading are different failures; choosing memory as a poor latency proxy does not itself make the reading Unknown.
Check it quickly
Save this as hpa_metric_sim.py and run python3 hpa_metric_sim.py. The standard-library model uses already-computed per-replica averages and starts inside its bounds. It demonstrates maximum selection and the failed-source scale-down guard. It is not an implementation of every HPA metric type.
import math
import sys


def desired_for(current, value, target):
    assert current > 0 and target > 0
    if value is None:
        return None
    assert value >= 0
    return math.ceil(current * value / target)


def decide(current, metrics, min_replicas, max_replicas):
    assert 0 < min_replicas <= current <= max_replicas
    recommendations = [desired_for(current, value, target)
                       for _, value, target in metrics]
    available = [want for want in recommendations if want is not None]
    if not available:
        return current
    want = max(available)
    if None in recommendations and want < current:
        return current
    return max(min_replicas, min(max_replicas, want))


def check(actual, expected, message):
    assert actual == expected, (message, actual, expected)
    print(f"OK: {message} -> {actual}")


def main():
    current = 4
    cpu = ("cpu", 80, 50)
    queue = ("average_queue", 900, 300)
    missing_queue = ("average_queue", None, 300)
    cool_cpu = ("cpu", 10, 50)
    check(decide(current, [cpu, queue], 1, 20), 12, "maximum wins")
    check(decide(current, [cpu, missing_queue], 1, 20), 7, "missing allows scale-up")
    check(decide(current, [cool_cpu, missing_queue], 1, 20), 4, "missing blocks scale-down")
    check(decide(current, [("cpu", None, 50), missing_queue], 1, 20), 4, "all missing holds")
    check(decide(current, [cpu, queue], 1, 10), 10, "upper bound")
    check(decide(current, [cool_cpu, ("average_queue", 30, 300)], 1, 20), 1, "valid low metrics shrink")
    check(decide(current, [cool_cpu], 2, 20), 2, "lower bound")
    print("PASS: 7 model scenarios; no Kubernetes controller was exercised")
    print(sys.version.split()[0])


if __name__ == "__main__":
    main()
The seven assertions produce recommendations of twelve and seven for the hot inputs, hold four when a failed source accompanies a shrink request, and hold four when all sources fail. They also check both bounds and a valid shrink to one. Both language copies passed locally with Python 3.12.14 during this review.
No cluster controller, metrics adapter, tolerance, readiness adjustment, stabilization window, or scaling-rate policy is exercised. The model’s explicit missing-source guard is its learning target. Validate real timestamps, conditions, and scaling events separately before treating arithmetic success as evidence that production autoscaling works.
Further reading
Sources
Kubernetes Horizontal Pod Autoscaling, documents algorithm and metric sources, checked 2026-10-15.
Resource Metrics Pipeline, documents metrics-server and the resource metrics API, checked 2026-10-15.
HorizontalPodAutoscaler walkthrough, Pods metrics use AverageValue; object/external types differ, checked 2026-10-15.