iotop connects task-level kernel accounting with a system-wide storage investigation. It can identify tasks reporting substantial IO or waiting, but those are different observations. A task blocked behind other work may be a victim rather than the source of contention. Kernel counters do not provide perfect attribution for every filesystem, cache, or storage layer.
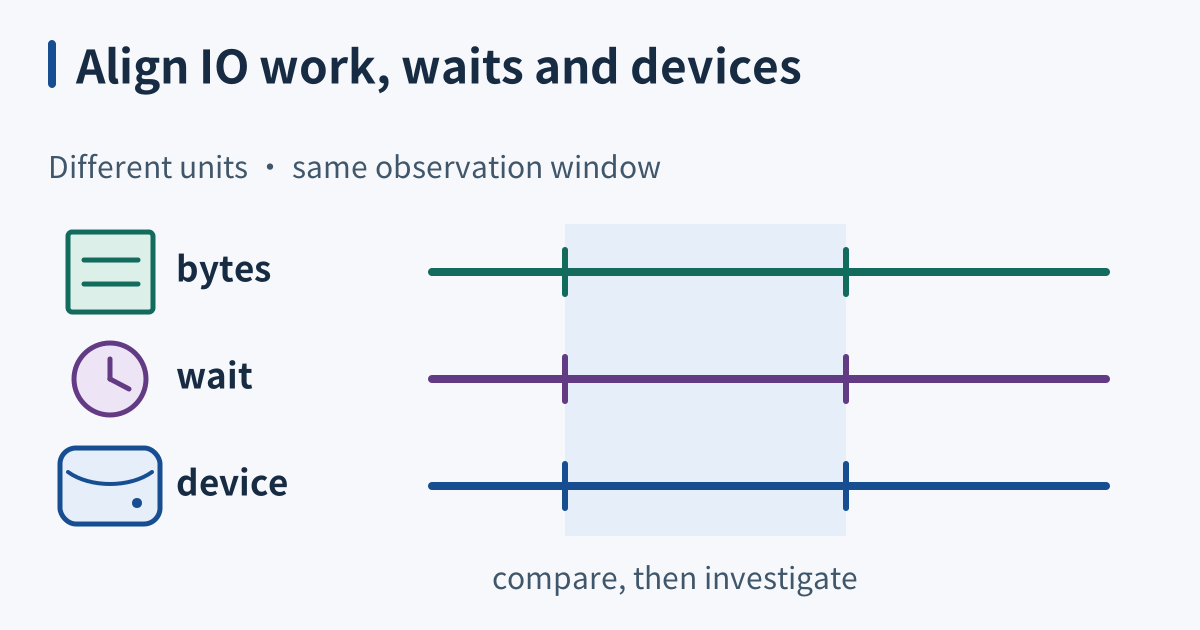
Use iotop beside device and application measurements. Neither an active writer nor a high wait value alone proves a storage bottleneck. Compare the same time window before deciding which component deserves closer inspection.
Per-process counters
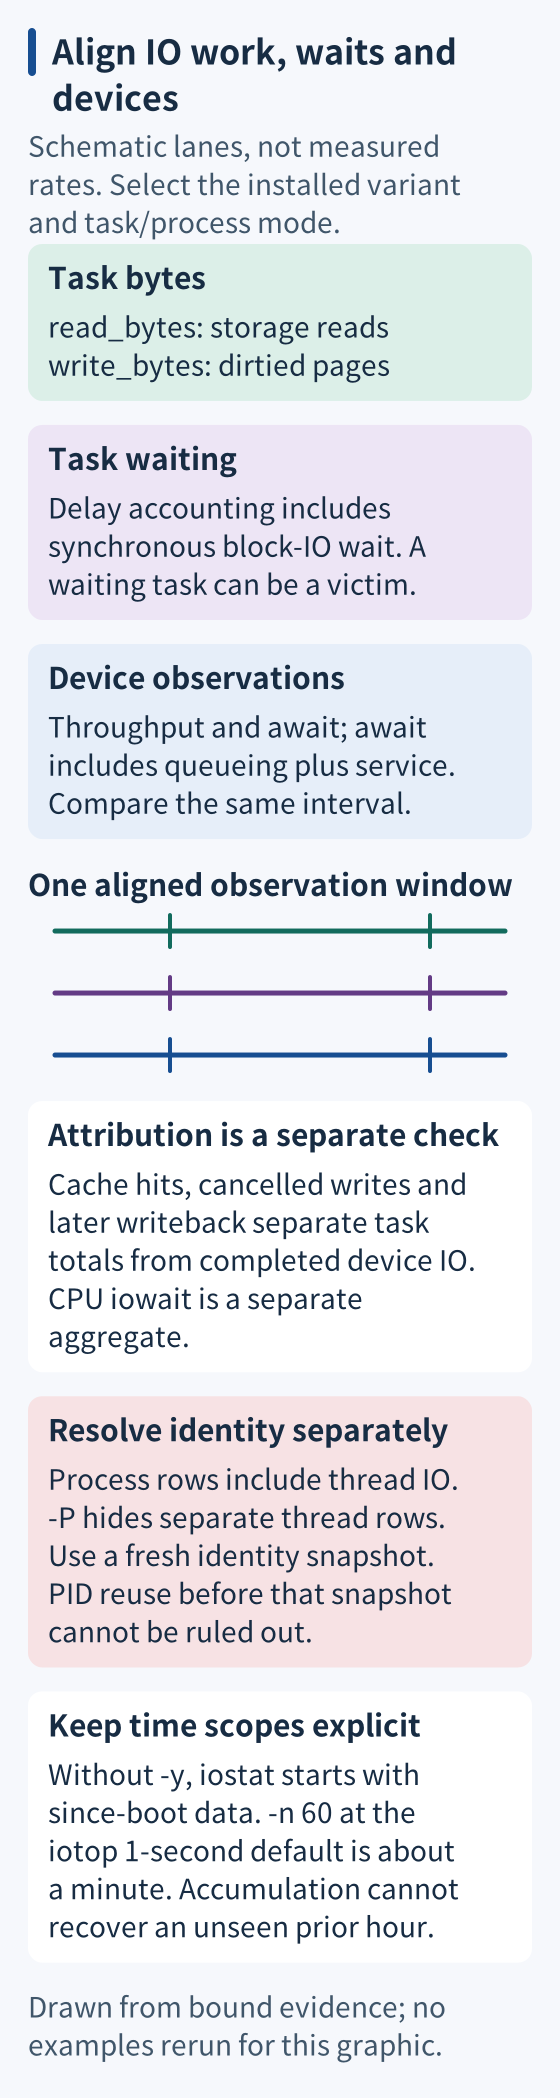
Check the installed implementation and version. In the cited iotop-c, main-process rows already include thread activity; -P hides separate thread rows. Other variants need their own manual. The -o option filters for observed IO activity; it does not classify harmful work. Read/write byte rates and IO-wait percentages have different units and should not be ranked as interchangeable measures.
Linux read_bytes accounts storage-layer reads; cached reads need not produce them. write_bytes is accounted when pages are dirtied, not necessarily when the device completes a write. Cancelled writes and later writeback can separate task totals from device throughput. Delay accounting records task waiting, including synchronous block-IO delay; CPU iowait is a separate aggregate and is not a reliable per-task blame measure.
See whatever sweeps the disk
Choose an explicit sort column and observe long enough to distinguish sustained work from a burst. A high write rate can be an expected backup, index build, or logging workload. Correlate process ownership, application role, and current work before changing scheduling or limits. A high rank identifies a candidate, not the correct remedy.
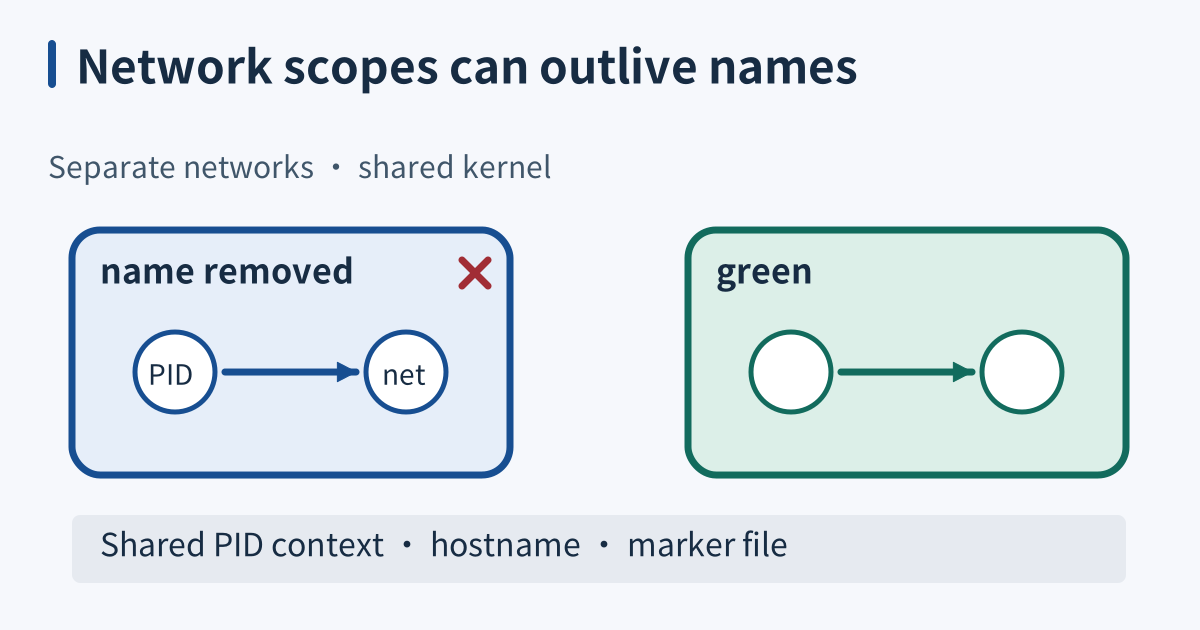
Resolve the task in the relevant PID namespace and verify that it still refers to the intended process. Command lines, parent relationships, and open files provide context, but an open file is not proof that all observed writes went there. PIDs can be reused between measurements; a stale number can point at unrelated work.
Watch before you act
Observation has costs and access requirements. Additional syscall tracing may perturb the process and expose arguments, so choose a separately authorized, scoped investigation when needed. An append flag belongs to opening a file; it is not a flag on each write syscall. Avoid presenting an imagined combination of outputs as a measured diagnosis.
Record collection conditions for a useful baseline: implementation, interval, process/thread mode, accumulation mode, and comparable workload. With the documented default one-second delay, -b -n 60 is roughly a minute, not five minutes. Device await includes queueing and service time; near-100-percent utilization does not establish saturation on every parallel SSD or RAID device.
When it breaks
Missing permissions, kernel accounting options, or enabled task delay accounting can cause failure or unavailable fields. An empty display does not exonerate either your processes or other users’ processes. Record the actual limitation and required environment; do not silently change capabilities or kernel settings to make the tool work. Some delay-accounting changes affect only tasks started afterward.
Bursty activity can disappear in averages, and short-lived tasks may escape sampling. Varying intervals changes what is visible. Accumulated mode summarizes observed accounting within its applicable lifetime; it does not recover an unrecorded previous hour or guarantee complete coverage of exited tasks. State the observation window with every conclusion.
Check it quickly
This unexecuted proposal targets the cited iotop-c interface and sysstat iostat. Confirm the installed implementations first. It captures full reports, stderr and both statuses without selecting a process from text. A fresh configuration directory prevents saved iotop preferences from silently changing the view.
(
  capture=$(mktemp -d) || exit 1
  printf 'Evidence directory: %s\n' "$capture"
  iotop --version || exit $?
  iostat -V || exit $?
  LC_ALL=C iostat -x -y -t 2 5 > "$capture/iostat.txt" 2> "$capture/iostat.err" &
  stat_pid=$!
  if LC_ALL=C XDG_CONFIG_HOME="$capture" iotop -b -P -k -t -d 2 -n 5 \
      --no-only --no-accumulated --no-accum-bw \
      > "$capture/iotop.txt" 2> "$capture/iotop.err"; then
    task_status=0
  else
    task_status=$?
  fi
  if wait "$stat_pid"; then stat_status=0; else stat_status=$?; fi
  printf 'iotop_status=%s iostat_status=%s\n' "$task_status" "$stat_status"
  cat "$capture/iotop.err" "$capture/iostat.err"
  [ "$task_status" -eq 0 ] && [ "$stat_status" -eq 0 ] || exit 1
  cat "$capture/iotop.txt" "$capture/iostat.txt"
)
In iotop-c, -P hides separate thread rows; their activity is already included in process totals. Fixed kilobyte units and non-accumulated mode support comparisons. This batch capture does not promise descending write order. Compare the labelled DISK WRITE values within each report; for an interactive ranking, explicitly select that column and descending direction. Never treat the first printed row as the largest writer.
Compare overlapping timestamped intervals; launch times are not perfectly synchronized. -y excludes iostat’s since-boot report. Missing counters, nonzero status or incomplete windows invalidate the comparison.
Save this helper as inspect_io_process.py. Select a process PID manually from the full report, in the same PID namespace. Python 3.9+, Linux pidfd support and readable proc entries are required:
"""Read-only Linux identity snapshot; requires Python 3.9+ and pidfd support."""
import json
import os
import re
import select
import sys


def snapshot(token, proc_root="/proc", ops=os, poll_factory=select.poll):
    if not re.fullmatch(r"[1-9][0-9]*", token):
        raise ValueError("PID must be a positive decimal process ID")
    pid = int(token)
    pidfd = ops.pidfd_open(pid, 0)
    directory = None
    try:
        directory = ops.open(f"{proc_root}/{pid}", os.O_RDONLY | os.O_DIRECTORY)
        watcher = poll_factory()
        watcher.register(pidfd, select.POLLIN)

        def read(name, limit):
            fd = ops.open(name, os.O_RDONLY, dir_fd=directory)
            with ops.fdopen(fd, "rb") as source:
                data = source.read(limit + 1)
            if len(data) > limit:
                raise ValueError(f"{name} exceeds the snapshot limit")
            return data

        def identity():
            head, tail = read("stat", 65536).rsplit(b")", 1)
            if int(head.split(b" ", 1)[0]) != pid:
                raise ValueError("stat PID mismatch")
            fields = tail.split()  # field 3 is index 0; field 22 is index 19
            if fields[0] in (b"Z", b"X", b"x"):
                raise ProcessLookupError("process has exited")
            return int(fields[19])

        before = identity()
        executable = ops.readlink("exe", dir_fd=directory)
        raw_command = read("cmdline", 65536)
        # Remove one final NUL; empty input means no argument data.
        command = raw_command[:-1] if raw_command.endswith(b"\0") else raw_command
        command = command.split(b"\0") if raw_command else []
        after = identity()
        if before != after or watcher.poll(0):
            raise ProcessLookupError("identity changed or process exited")
        return {"pid": pid, "starttime_ticks": before, "executable": executable,
                "argv": [arg.decode("utf-8", "backslashreplace") for arg in command]}
    finally:
        if directory is not None:
            ops.close(directory)
        ops.close(pidfd)


if __name__ == "__main__":
    try:
        if len(sys.argv) != 2:
            raise ValueError("usage: inspect_io_process.py PID")
        print(json.dumps(snapshot(sys.argv[1]), ensure_ascii=True))
    except (OSError, ValueError, IndexError, AttributeError) as error:
        sys.exit(f"Identity snapshot failed: {error}")
python3 inspect_io_process.py "${PID:?Set PID from the reviewed process row}"
A successful snapshot reports an executable, arguments and stable start-time value while checking a pidfd for exit. Permission, missing-process or unavailable-pidfd errors stop the check. PID reuse before acquiring the handle cannot be excluded; this snapshot does not prove identity at the earlier sample. Proc fields can change and are not atomic. Recheck before any later action; nothing is killed or reprioritized here.
Sources
iotop man page, rendered iotop-c manual; verify the installed variant, checked 2026-10-18.
vmstat man page, documents system-wide CPU and IO-wait reporting, checked 2026-09-05.
Linux delay accounting, taskstats delay scope and enablement prerequisites, checked 2026-10-18.
Linux proc filesystem, storage byte accounting, cancelled writes, and CPU iowait limits, checked 2026-10-18.
iostat manual, first report, await, and parallel-device utilization limits, checked 2026-10-18.
iotop-c upstream manual, process aggregation, batch options, configuration and interactive sorting, checked 2026-10-19.
sysstat upstream iostat manual, -y omits the since-boot report and -t timestamps interval reports, checked 2026-10-19.
pidfd_open manual, bounded identity or controlled-operation contract, checked 2026-10-19.
Python os interfaces, bounded identity or controlled-operation contract, checked 2026-10-19.
proc_pid_stat manual, bounded identity or controlled-operation contract, checked 2026-10-19.