Metrics and logs are different representations of observed behavior, not competing definitions of truth. A metric usually summarizes measurements under a set of dimensions. A log record describes an event and can carry detailed context. Both can answer aggregate questions if their coverage and semantics support the calculation. Neither becomes authoritative merely because its dashboard looks cleaner or its records contain more fields.
For a checkout service, a completed-request counter can classify every terminal outcome as success or error. A few bounded dimensions, such as route and outcome, make it practical to compare traffic and failure rates over time. A diagnostic log can then explain a particular failed request using its correlation identifier, error category, and dependency response. These serve related questions, but their denominators must still be established separately.
Decide what the measurement includes
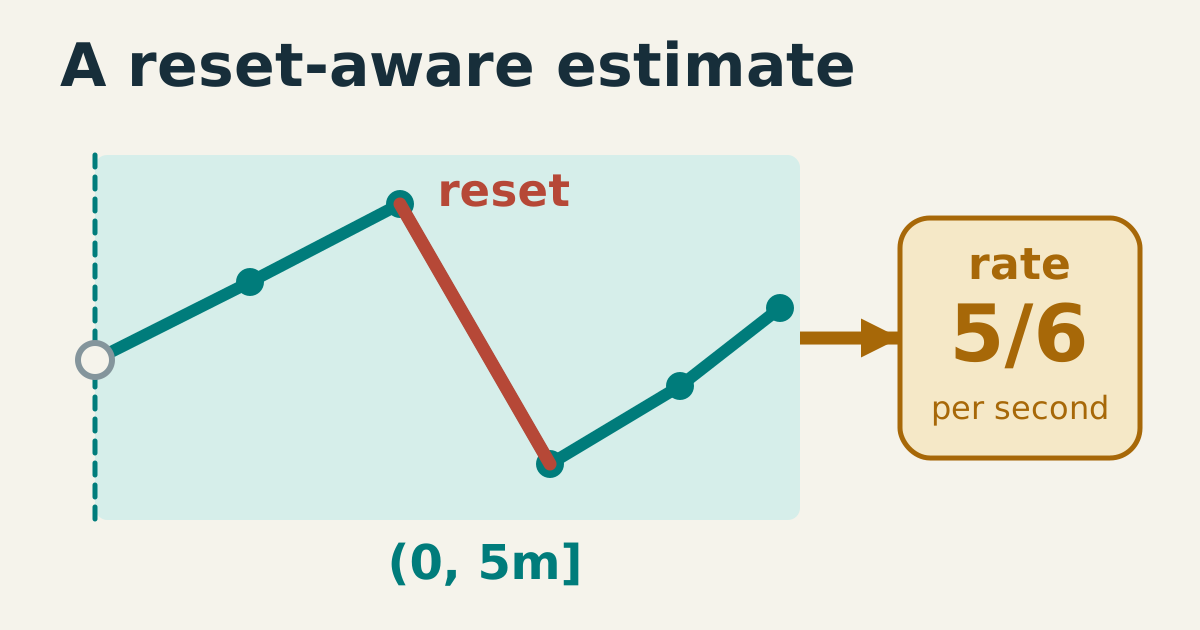
A cumulative counter is not itself a requests-per-second measurement. A live rate calculation needs observations across time and handling for resets. A complete synthetic batch, however, can be counted directly because its beginning, end, and membership are known. Do not silently replace a windowed production rate with a ratio of unrelated snapshots, or compare a sampled event stream against a counter covering every request.
Logs are not limited to manual reading. Consistently structured, complete terminal events can be aggregated into the same request totals as a counter. The tradeoff includes event volume, indexing, query latency, retention, and operational complexity. Metrics are often economical for repeated aggregate questions, but a metric with a new label value for every request can be expensive. The representation alone does not settle cost.
When it breaks
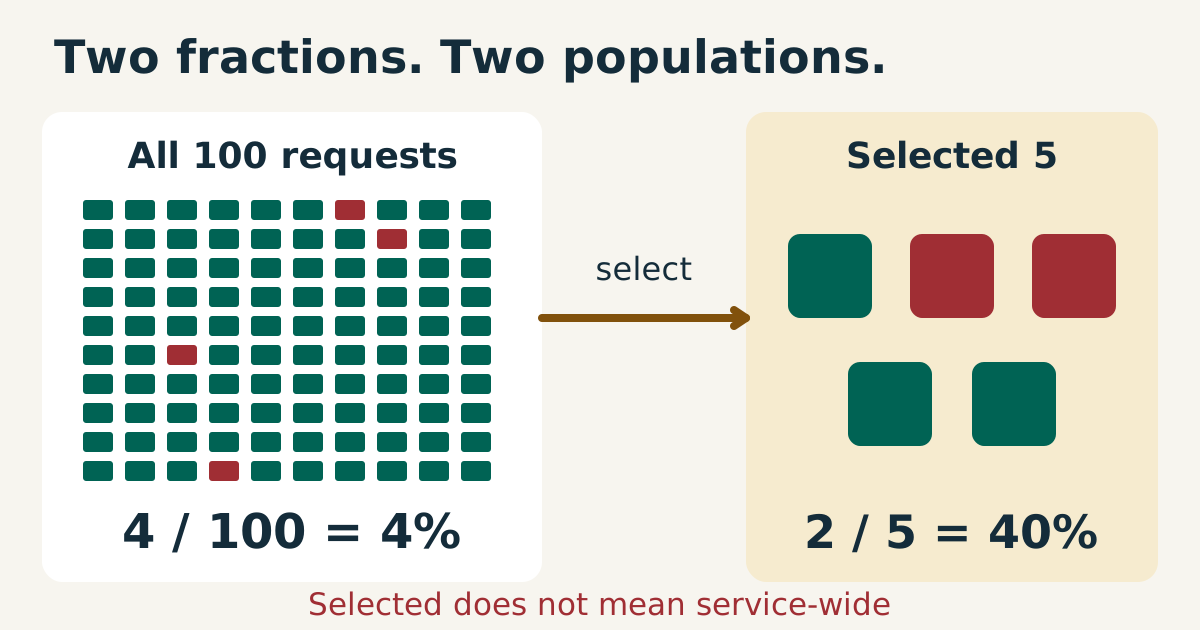
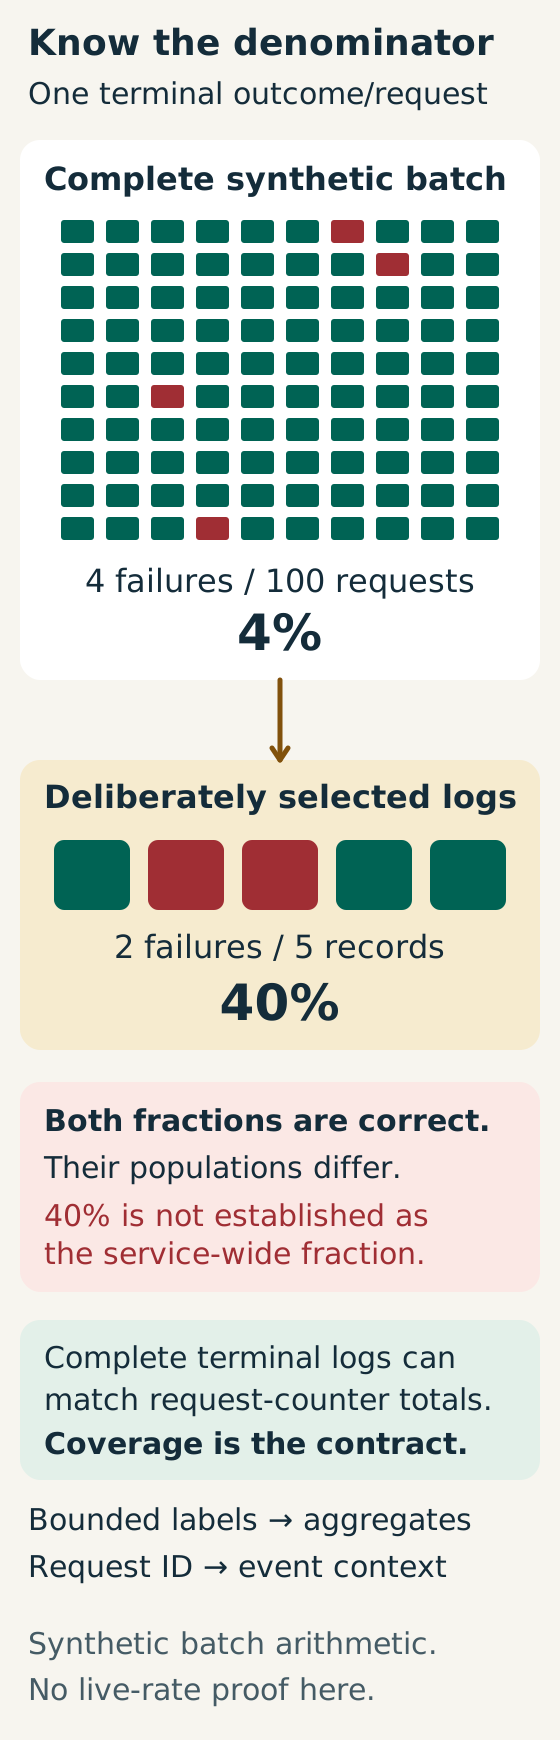
Consider a hundred completed requests with four failures. An incident-focused log selection retains five requests, including two failures. The complete population has a four-percent failure fraction, while the selected logs have a forty-percent fraction. Both calculations are arithmetically correct. Presenting the second as the service-wide failure rate is wrong because the five records were not a complete or representative population.
Counting retry failures as terminal request failures creates another mismatch: a request may fail an attempt and later succeed. Missing logs, duplicated deliveries, differing time windows, and incompatible route definitions can also make apparently related charts disagree. Define one terminal outcome per request for the reliability measure, then keep attempt-level evidence for diagnosis. Never repair the discrepancy merely by changing the chart label or averaging the two percentages.
Check it quickly
Save this as metrics-logs.py and run it with Python 3 and an official promtool binary on PATH. The retained 2026-10-15 review ran the complete example with Python 3.12.14 and promtool 3.14.0. The actual validator reads the generated exposition from standard input; no server, container, or network connection is created. The synthetic population is complete by construction, while its diagnostic log subset is deliberately selected rather than randomly sampled.
import json
import subprocess
from collections import Counter

# A complete synthetic population, with exactly one terminal outcome per request.
requests = [{"request_id": f"r{i}", "route": "/checkout",
             "outcome": "error" if i in {7, 18, 53, 94} else "success"}
            for i in range(1, 101)]
counter = Counter(request["outcome"] for request in requests)
selected_logs = [request for i, request in enumerate(requests, 1)
                 if i in {1, 7, 18, 33, 55}]
logged_errors = sum(record["outcome"] == "error" for record in selected_logs)
text = "# HELP demo_requests_total Completed synthetic requests.\n# TYPE demo_requests_total counter\n"
for outcome, count in sorted(counter.items()):
    text += f'demo_requests_total{{route="/checkout",outcome="{outcome}"}} {count}\n'
version = subprocess.run(["promtool", "--version"], capture_output=True, text=True, check=True).stdout.splitlines()[0]
result = subprocess.run(["promtool", "check", "metrics"], input=text,
                        text=True, capture_output=True, timeout=30)
assert result.returncode == 0, result.stdout + result.stderr
population_rate = counter["error"] / len(requests)
selected_rate = logged_errors / len(selected_logs)
assert population_rate == 0.04 and selected_rate == 0.4
assert "request_id" not in text and len(counter) == 2
# Full event coverage would recover the same aggregate; these five logs cannot.
assert sum(r["outcome"] == "error" for r in requests) == counter["error"]
print(json.dumps({"requests": len(requests), "errors": counter["error"],
                  "population_error_rate": population_rate, "exposed_metric_series": len(counter),
                  "selected_logs": len(selected_logs), "selected_log_errors": logged_errors,
                  "selected_log_error_rate": selected_rate,
                  "exposition_validated_by": version}, indent=2))
The result should report one hundred requests, four errors, and a population fraction of 0.04. Five selected log records contain two errors, producing 0.4. The exposition has two counter series distinguished by outcome, and its labels contain no request identifier. Promtool validates the exported format; the Python assertions establish the arithmetic and the deliberate difference in populations. This is not a live scrape, counter-reset test, or storage-cost benchmark.
For real investigations, use bounded metric dimensions to locate the affected route, outcome, or deployment. Follow a correlation identifier into logs or traces when individual context is needed. Keep that identifier out of ordinary metric labels unless a justified cardinality budget supports it; exemplars can provide a separate link when the stack supports them. Finally, document event completeness and selection rules next to derived rates. A chart becomes trustworthy when its unit, population, and time basis are clear enough for another person to reproduce its meaning.
Further reading
- Certificate expiry is a date, not a dashboard color
- HEAD should describe the same representation as GET
Sources
- OpenTelemetry metrics, measurements and aggregation over a population, checked 2026-09-13.
- OpenTelemetry logs, event records and their relationship to other telemetry, checked 2026-09-13.
- Prometheus metric and label naming, bounded labels and the cost of high-cardinality dimensions, checked 2026-09-13.