A latency mean can conceal a slow subset of requests. A histogram retains more distribution information by counting observations into buckets, but it still discards detail within each bucket. Prometheus can estimate quantiles from those counts without storing every observation. The estimate depends on bucket boundaries and aggregation; it is not a recovery of the complete original latency distribution.
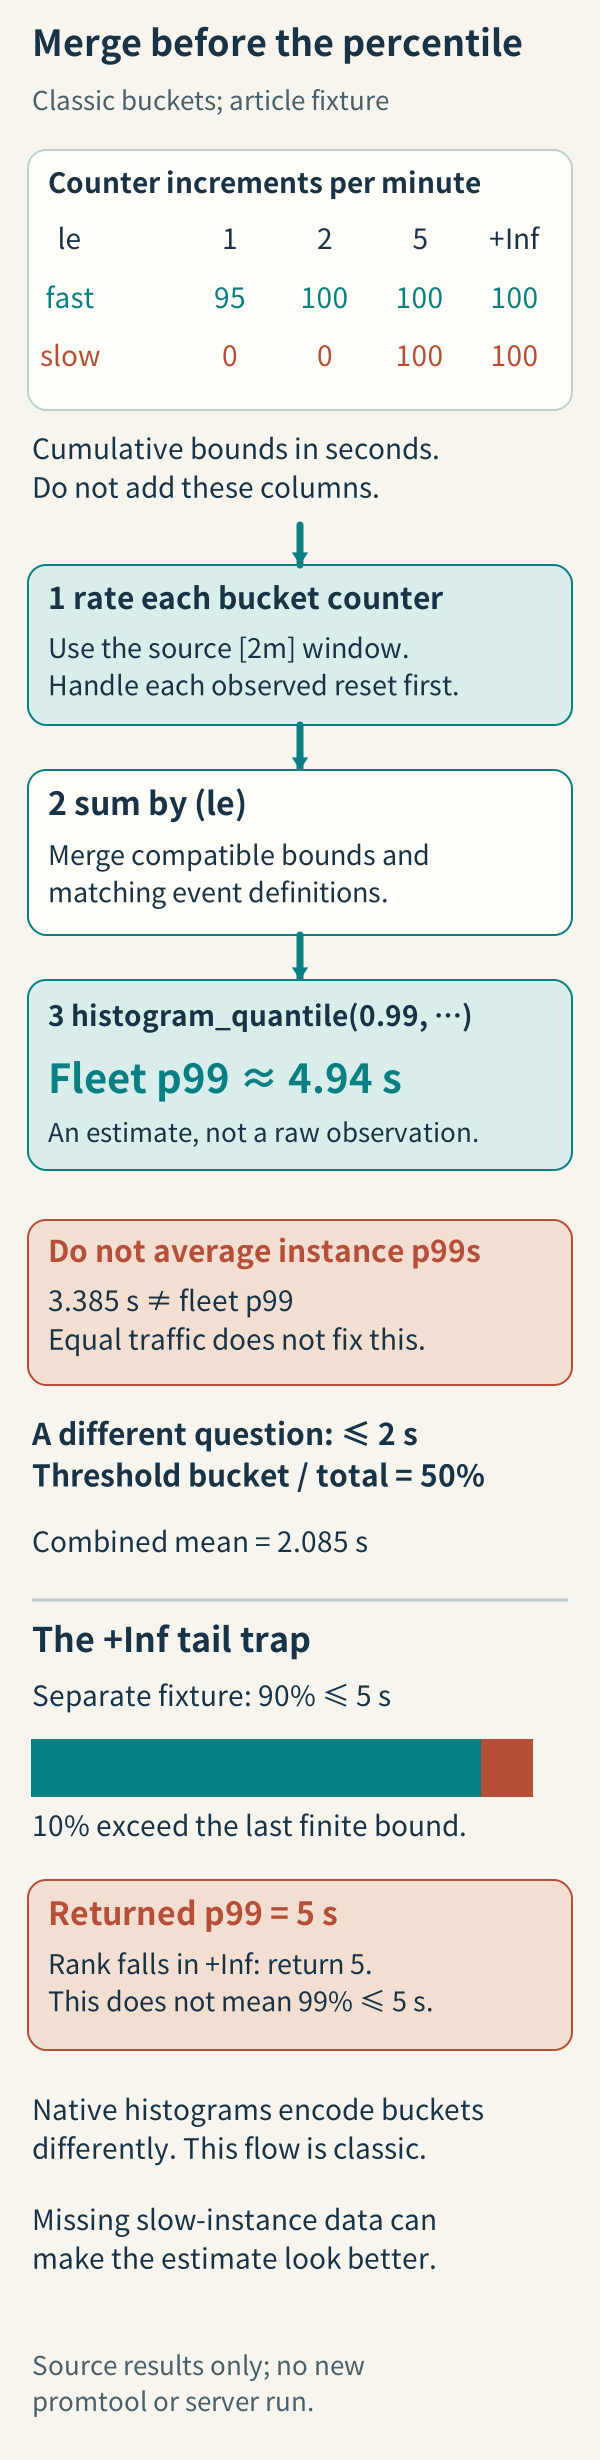
Classic histograms are several related series
A classic histogram exports cumulative _bucket counters, a _count, and a _sum. The le label identifies each inclusive bucket upper bound. An observation of 1.5 seconds increments the two-second bucket and every larger bucket, so bucket values must not be summed as though they were disjoint counts. The positive-infinity bucket includes all observations and corresponds to the count.
For nonnegative latency observations, applying rate to the sum and count gives total seconds accumulated per second and observations per second. Their ratio is mean latency in seconds. Bucket rates describe the distribution over the selected time range. Apply the counter rate before aggregating instances so each series’ observed reset is handled independently.
Aggregate buckets before estimating a quantile
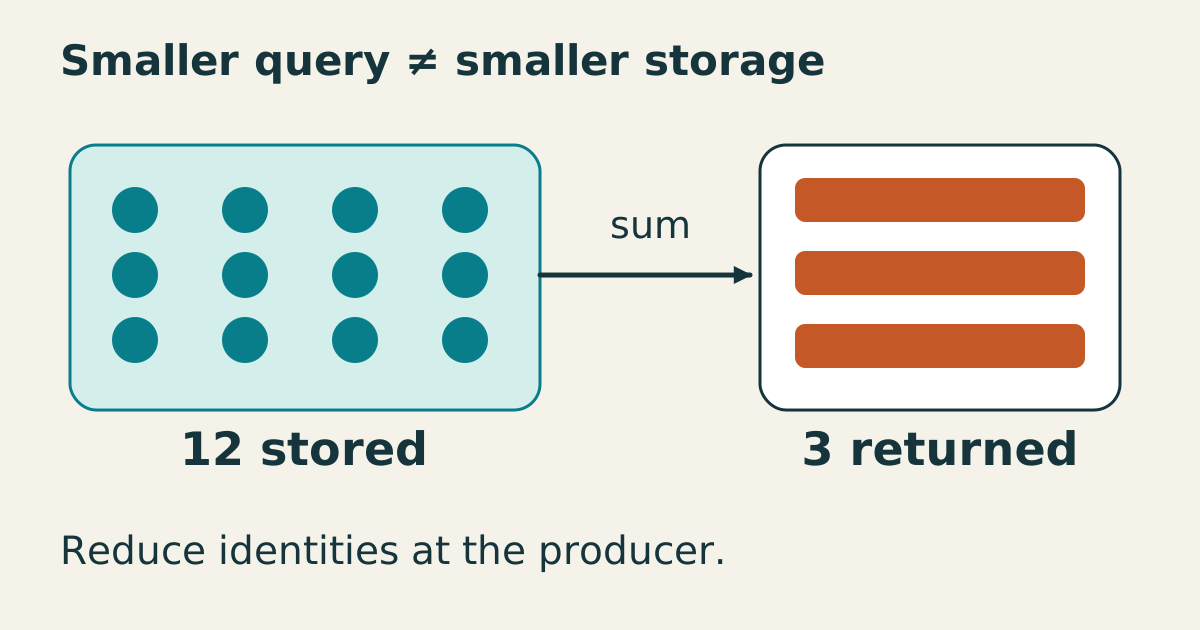
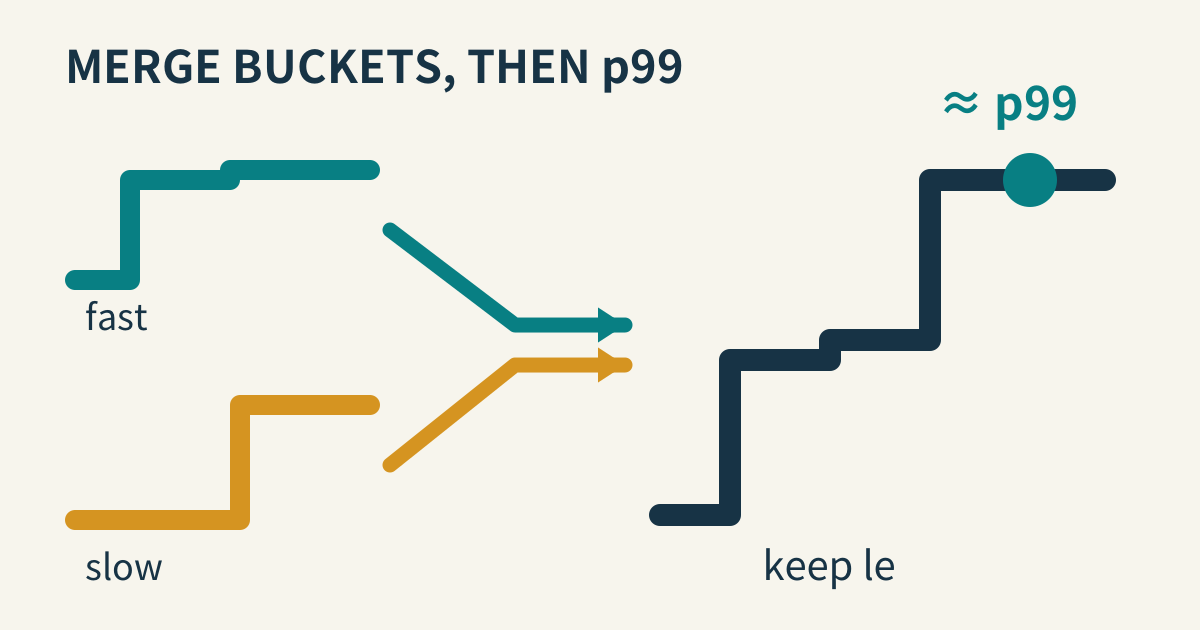
For one fleet percentile, sum the bucket rates while retaining le, then call histogram_quantile. Keep any grouping dimensions required by the question, such as service. Compatible bucket boundaries and matching event definitions are necessary for meaningful aggregation. Removing le destroys the bucket identity the classic quantile function needs.
Do not average instance percentiles. A percentile is a position in a distribution, not an additive count, and even equal request volumes do not make percentile averaging valid. The combined bucket curve can have a very different shape from either instance. If the question is the fraction meeting a two-second objective, a bucket exactly at two seconds divided by the total count answers that threshold question directly.
A summary may export client-computed quantiles. Those values cannot be merged into a fleet quantile by summing or averaging them. Its count and sum can still contribute to a combined mean when event definitions match. Select the metric type from the aggregation you need, not solely from a panel’s preferred display.
When it breaks
A wide bucket near the desired percentile can make the estimate look more precise than the measurements justify. Classic quantile calculation interpolates within the selected bucket; it does not know where the individual observations occurred inside it. Keep boundaries useful around service objectives, and review them before a rollout that mixes different schemas across replicas. Refining future buckets cannot recover detail already discarded from historical observations.
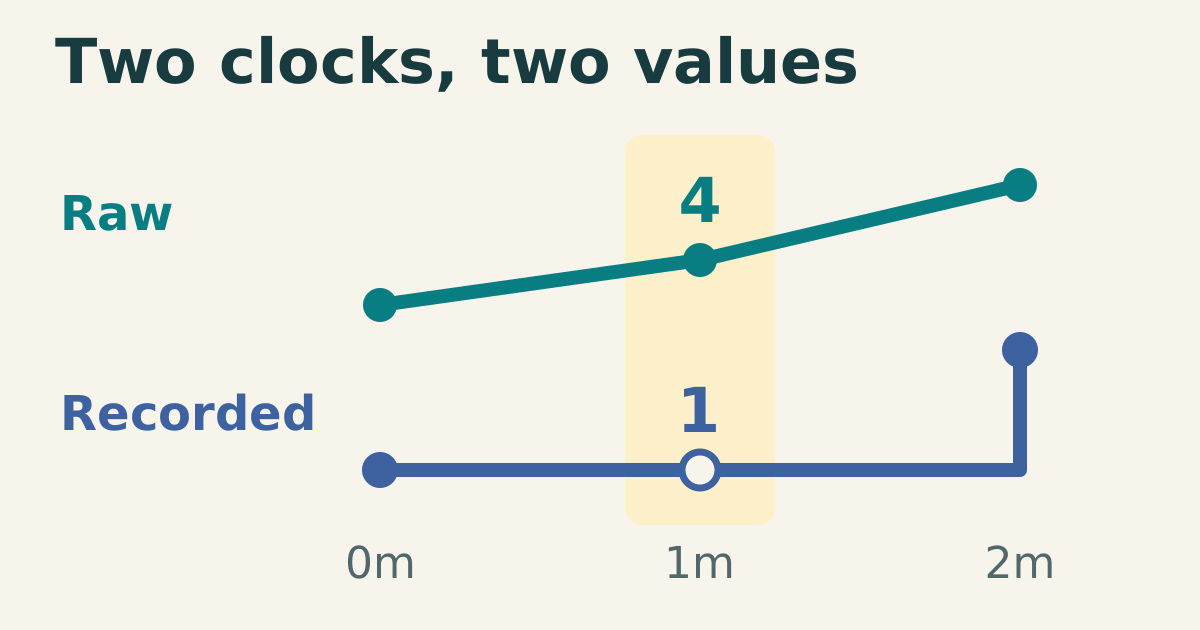
A missing bucket or exporter is also different from zero observations. An apparently better percentile can result from losing the slow instance’s metrics. Check scrape completeness, contributing series, and sample counts before interpreting improvement. A present histogram with zero observations yields NaN from histogram_quantile; a missing input can produce no result at all. Neither means zero latency, and sparse observations still make a percentile fragile.
Check it quickly
Save this as histogram-query.py and run python3 histogram-query.py with an installed promtool on PATH, or set PROMTOOL to its executable path. The recorded earlier execution used Python 3.12.14 and promtool 3.14.0; it was not rerun during this source review. The real query engine evaluates synthetic samples in a temporary directory; no server, listener, container or external service is started.
from pathlib import Path
from tempfile import TemporaryDirectory
import os
import shutil
import subprocess

# Uses a real, installed promtool; no server or Docker runtime is started.
promtool = shutil.which(os.environ.get("PROMTOOL", "promtool"))
if not promtool:
    raise SystemExit("Set PROMTOOL to an installed promtool executable")

tests = r"""evaluation_interval: 1m
tests:
  - interval: 1m
    input_series:
      - series: "api_duration_seconds_bucket{instance=\"fast\",le=\"1\"}"
        values: "0+95x5"
      - series: "api_duration_seconds_bucket{instance=\"fast\",le=\"2\"}"
        values: "0+100x5"
      - series: "api_duration_seconds_bucket{instance=\"fast\",le=\"5\"}"
        values: "0+100x5"
      - series: "api_duration_seconds_bucket{instance=\"fast\",le=\"+Inf\"}"
        values: "0+100x5"
      - series: "api_duration_seconds_count{instance=\"fast\"}"
        values: "0+100x5"
      - series: "api_duration_seconds_sum{instance=\"fast\"}"
        values: "0+17x5"
      - series: "api_duration_seconds_bucket{instance=\"slow\",le=\"1\"}"
        values: "0+0x5"
      - series: "api_duration_seconds_bucket{instance=\"slow\",le=\"2\"}"
        values: "0+0x5"
      - series: "api_duration_seconds_bucket{instance=\"slow\",le=\"5\"}"
        values: "0+100x5"
      - series: "api_duration_seconds_bucket{instance=\"slow\",le=\"+Inf\"}"
        values: "0+100x5"
      - series: "api_duration_seconds_count{instance=\"slow\"}"
        values: "0+100x5"
      - series: "api_duration_seconds_sum{instance=\"slow\"}"
        values: "0+400x5"
      - series: 'tail_duration_seconds_bucket{le="1"}'
        values: "0+0x5"
      - series: 'tail_duration_seconds_bucket{le="5"}'
        values: "0+90x5"
      - series: 'tail_duration_seconds_bucket{le="+Inf"}'
        values: "0+100x5"
    promql_expr_test:
      - expr: "abs(histogram_quantile(0.99, sum by (le) (rate(api_duration_seconds_bucket[2m]))) - 4.94) < bool 1e-12"
        eval_time: 5m
        exp_samples:
          - labels: "{}"
            value: 1
      - expr: "abs(avg(histogram_quantile(0.99, rate(api_duration_seconds_bucket[2m]))) - 3.385) < bool 1e-12"
        eval_time: 5m
        exp_samples:
          - labels: "{}"
            value: 1
      - expr: "sum(rate(api_duration_seconds_bucket{le=\"2\"}[2m])) / sum(rate(api_duration_seconds_count[2m]))"
        eval_time: 5m
        exp_samples:
          - labels: "{}"
            value: 0.5
      - expr: "abs(sum(rate(api_duration_seconds_sum[2m])) / sum(rate(api_duration_seconds_count[2m])) - 2.085) < bool 1e-12"
        eval_time: 5m
        exp_samples:
          - labels: "{}"
            value: 1
      - expr: 'histogram_quantile(0.99, rate(tail_duration_seconds_bucket[2m]))'
        eval_time: 5m
        exp_samples:
          - labels: '{}'
            value: 5
"""
rules = r""""""

with TemporaryDirectory(prefix="prometheus-query-check-") as directory:
    root = Path(directory)
    (root / "tests.yml").write_text(tests, encoding="utf-8")
    if rules:
        (root / "rules.yml").write_text(rules, encoding="utf-8")
    result = subprocess.run([promtool, "test", "rules", "tests.yml"],
                            cwd=root, text=True, capture_output=True, timeout=45)
    print(result.stdout, end="")
    if result.returncode:
        print(result.stderr, end="")
        raise SystemExit(result.returncode)
The expected output is SUCCESS. The correctly combined p99 estimate is 4.94 seconds. Averaging the two instance p99 estimates produces 3.385 seconds, which is not the fleet p99. Half the observations meet the two-second threshold, and the combined mean is 2.085 seconds. Numerical assertions allow a tiny floating-point tolerance rather than requiring an identical binary representation of decimal fractions.
The fixture validates PromQL arithmetic and aggregation, not actual request instrumentation or the distribution within a bucket. It removes its temporary test files after execution. Current Prometheus guidance also discusses native histograms, which encode buckets differently and can simplify queries when the instrumentation and storage path support them. This example deliberately targets classic histograms: retain le, aggregate their counter rates correctly, and describe the returned percentile as an estimate.
A second histogram places ten percent of observations beyond its largest finite boundary of five seconds. Its p99 still returns five: for a classic quantile falling in the positive-infinity bucket, the function returns the preceding finite upper bound. That number is not a measured maximum or proof that ninety-nine percent finished within five seconds. The added assertion makes this reporting trap explicit.
Sources
- Prometheus: histograms and summaries, bucketed observations, aggregation and metric choices, checked 2026-10-15.
- Prometheus: query functions, classic histogram_quantile interpolation and rate ordering, checked 2026-10-15.
- Prometheus: unit testing rules, executing expected PromQL values, checked 2026-10-15.