A request counter answers how many events an instrumented process has accumulated. A rate answers how quickly those events are arriving. Prometheus rate estimates average growth per second over a selected range, adjusts observed counter resets, and extrapolates toward the range boundaries. The result is useful precisely because it has a time unit, but it is not an exact reconstruction of every event between scrapes.
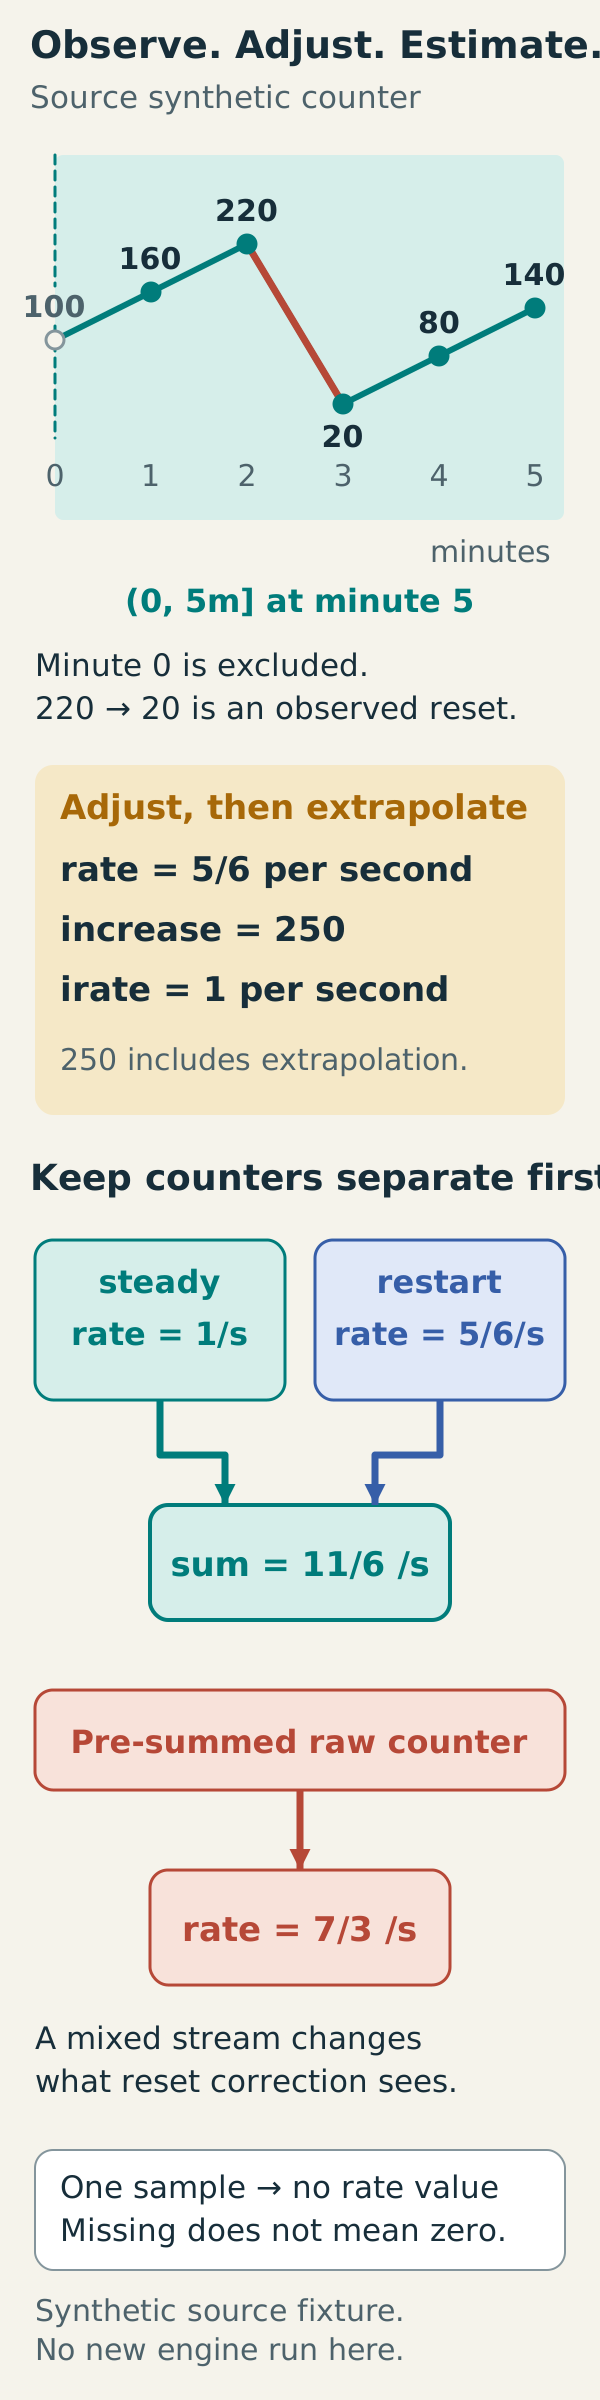
Sampling determines what can be inferred
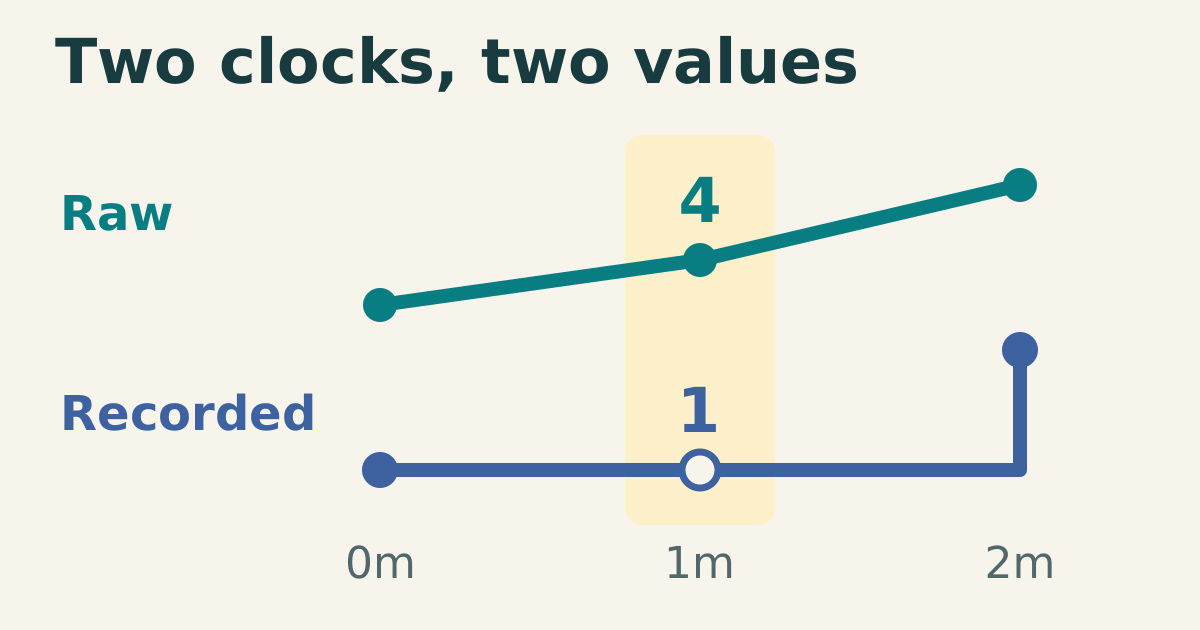
An ordinary counter increases until it resets, commonly after a restart. A decrease between observed samples is treated as a reset by the counter functions. A restart and recovery entirely between two scrapes may be invisible if the new value already exceeds the previous sample. More frequent scraping improves observation resolution; no query can recover an unobserved history with certainty.
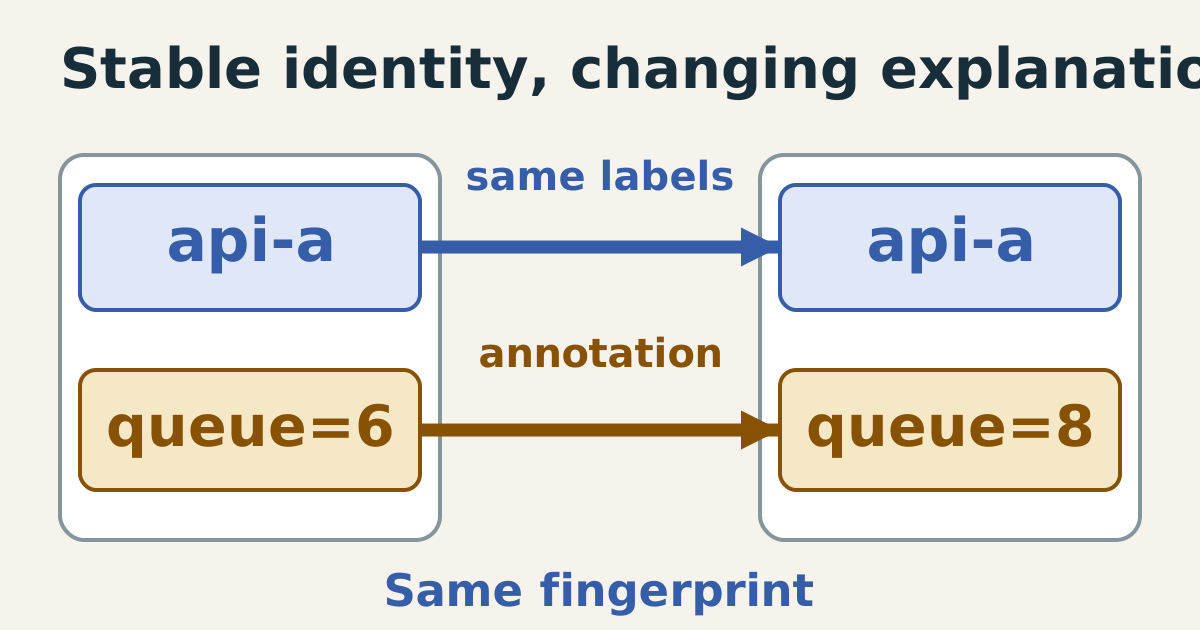
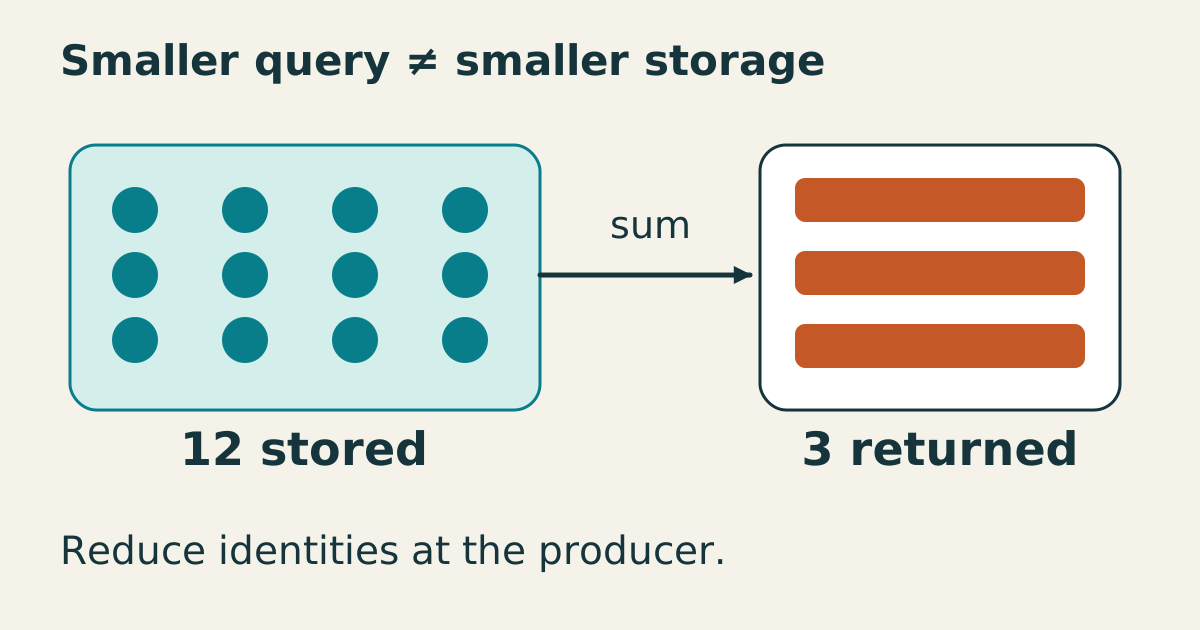
Apply rate to individual counter series before aggregating them. Summing first can let one instance’s growth hide another instance’s reset. Labels define series identity, so a replacement instance with different labels starts a different series rather than continuing the old one. A gauge such as queue depth can fall normally and should not be interpreted as a resetting counter.
The selected range is part of the meaning
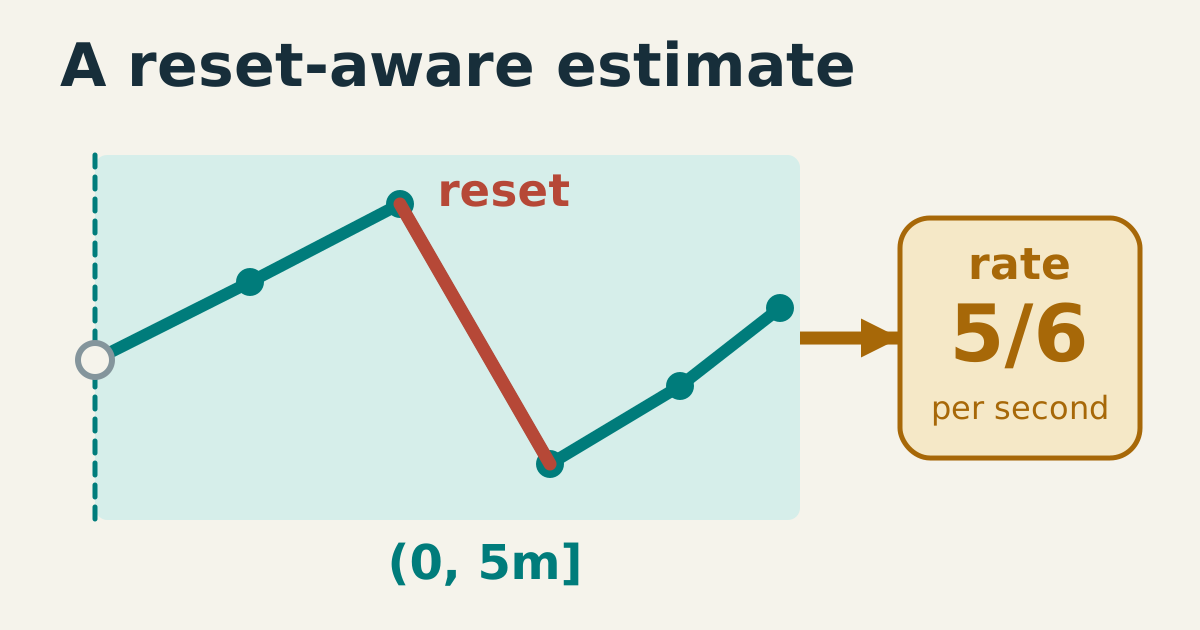
A range selector is open at its left boundary and closed at its right boundary. At minute five, [5m] excludes a sample exactly at minute zero. The float-counter calculation needs at least two usable samples. A range containing one sample produces no rate value; it does not establish zero traffic. Leave enough room for the configured cadence and realistic missed scrapes.
Longer windows generally smooth short bursts and delay their disappearance from the average. Shorter windows respond sooner but offer fewer observations and can become empty. Choose the window from the event duration and detection objective, then label it explicitly. irate uses the last two samples, whereas rate uses the selected range. Both can be useful on the same metric if panels explain their different questions. Prefer rate for alerting: brief dips in irate can reset a pending alert’s for timer even while load remains broadly elevated.
The query evaluation interval controls when a rule asks the question, not which samples were scraped. Refreshing a dashboard every second cannot create new observations from a target scraped every minute. Inspect these two cadences separately when assessing alert responsiveness.
When it breaks
A newly created series may vanish from a rate panel until a second sample arrives. Filling every missing result with zero can conceal collection failure. Check the raw series, timestamps, and scrape status before treating a blank panel as idle traffic. A very smooth long-window line can also hide a brief overload that matters to users.
Reset adjustment is not immunity to gaps. Missing samples can hide bursts or multiple restarts, and boundary extrapolation introduces estimation. increase applies the corresponding range estimate in event-count units; it may return a fractional count even for integer counters. Use application accounting records when exact totals are required, rather than promising that a dashboard reconstructs them.
Check it quickly
Save this as rate.py and run python3 rate.py with an installed promtool on PATH, or set PROMTOOL to its executable path. The recorded earlier execution used Python 3.12.14 and promtool 3.14.0; it was not rerun during this source review. The real query engine evaluates synthetic samples in a temporary directory; no server, listener, container or external service is started.
from pathlib import Path
from tempfile import TemporaryDirectory
import os
import shutil
import subprocess

# Uses a real, installed promtool; no server or Docker runtime is started.
promtool = shutil.which(os.environ.get("PROMTOOL", "promtool"))
if not promtool:
    raise SystemExit("Set PROMTOOL to an installed promtool executable")

tests = r"""evaluation_interval: 1m
tests:
  - interval: 1m
    input_series:
      - series: "demo_requests_total{instance=\"steady\"}"
        values: "0+60x5"
      - series: "demo_requests_total{instance=\"restart\"}"
        values: "100 160 220 20 80 140"
      - series: "demo_requests_total{instance=\"gaps\"}"
        values: "0 60 _ 180 _ 300"
      - series: "demo_requests_total{instance=\"one\"}"
        values: "_ _ _ _ _ 7"
      - series: "combined_requests_total"
        values: "100 220 340 200 320 440"
    promql_expr_test:
      - expr: "rate(demo_requests_total{instance=\"steady\"}[5m])"
        eval_time: 5m
        exp_samples:
          - labels: "{instance=\"steady\"}"
            value: 1
      - expr: "abs(rate(demo_requests_total{instance=\"restart\"}[5m]) - 5/6) < bool 1e-12"
        eval_time: 5m
        exp_samples:
          - labels: "{instance=\"restart\"}"
            value: 1
      - expr: "increase(demo_requests_total{instance=\"restart\"}[5m])"
        eval_time: 5m
        exp_samples:
          - labels: "{instance=\"restart\"}"
            value: 250
      - expr: "irate(demo_requests_total{instance=\"restart\"}[5m])"
        eval_time: 5m
        exp_samples:
          - labels: "{instance=\"restart\"}"
            value: 1
      - expr: "rate(demo_requests_total{instance=\"gaps\"}[5m])"
        eval_time: 5m
        exp_samples:
          - labels: "{instance=\"gaps\"}"
            value: 1
      - expr: "rate(demo_requests_total{instance=\"one\"}[5m])"
        eval_time: 5m
        exp_samples: []
      - expr: 'abs(sum(rate(demo_requests_total{instance=~"steady|restart"}[5m])) - 11/6) < bool 1e-12'
        eval_time: 5m
        exp_samples:
          - labels: '{}'
            value: 1
      - expr: 'abs(rate(combined_requests_total[5m]) - 7/3) < bool 1e-12'
        eval_time: 5m
        exp_samples:
          - labels: '{}'
            value: 1
"""
rules = r""""""

with TemporaryDirectory(prefix="prometheus-query-check-") as directory:
    root = Path(directory)
    (root / "tests.yml").write_text(tests, encoding="utf-8")
    if rules:
        (root / "rules.yml").write_text(rules, encoding="utf-8")
    result = subprocess.run([promtool, "test", "rules", "tests.yml"],
                            cwd=root, text=True, capture_output=True, timeout=45)
    print(result.stdout, end="")
    if result.returncode:
        print(result.stderr, end="")
        raise SystemExit(result.returncode)
Successful assertions print SUCCESS. The steady series grows at one request per second. For samples 100 160 220 20 80 140, the five-minute rate is 5/6, increase is 250, and irate is one. These differ because the selected range excludes the first sample, corrects the observed reset, and extrapolates its average across the requested duration.
The deliberately linear series with gaps still yields one per second; that controlled result does not prove arbitrary gaps harmless. The one-sample series yields an empty vector. The test checks values and absence separately, using numerical tolerance for the repeating fraction. Before deploying a rule, add representative restart, sparse-traffic, and missing-data cases from the service whose counter you will monitor.
The last two checks expose an aggregation error: the steady and restarting series together yield 11/6 requests per second when rated separately. Their pre-summed sample stream yields 7/3 because reset correction is now applied to the mixture. Both calculations execute successfully; a valid query is not proof that its counter identity was preserved.
Sources
- Prometheus: query functions, rate, increase, irate and reset adjustment, checked 2026-10-15.
- Prometheus: querying basics, range boundaries and sample selection, checked 2026-10-15.
- Prometheus: unit testing rules, synthetic samples and expression assertions, checked 2026-10-15.