An alerting rule evaluates a PromQL expression and tracks the returned label sets over time. Prometheus decides whether each resulting alert is pending or firing. Alertmanager receives alert information and handles notification routing, grouping, silencing, and inhibition. A reliable investigation follows those stages separately: a firing alert is evidence of rule state, not proof that a person received a message.
Vector membership activates the alert
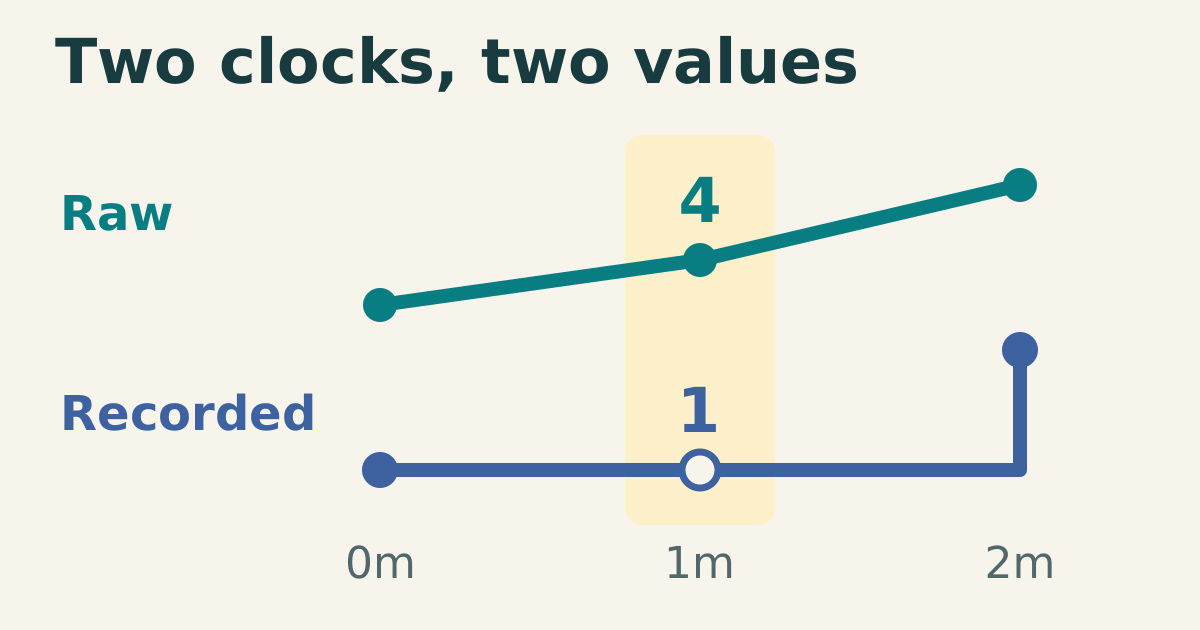
Each element returned by the expression represents an active alert candidate. A comparison such as queue_depth > 5 filters out values that do not meet the threshold. Adding the bool modifier changes comparison behavior: false comparisons remain as elements with value zero. An alert rule tests the presence of elements, so using that modifier can activate an alert even when the number is zero.
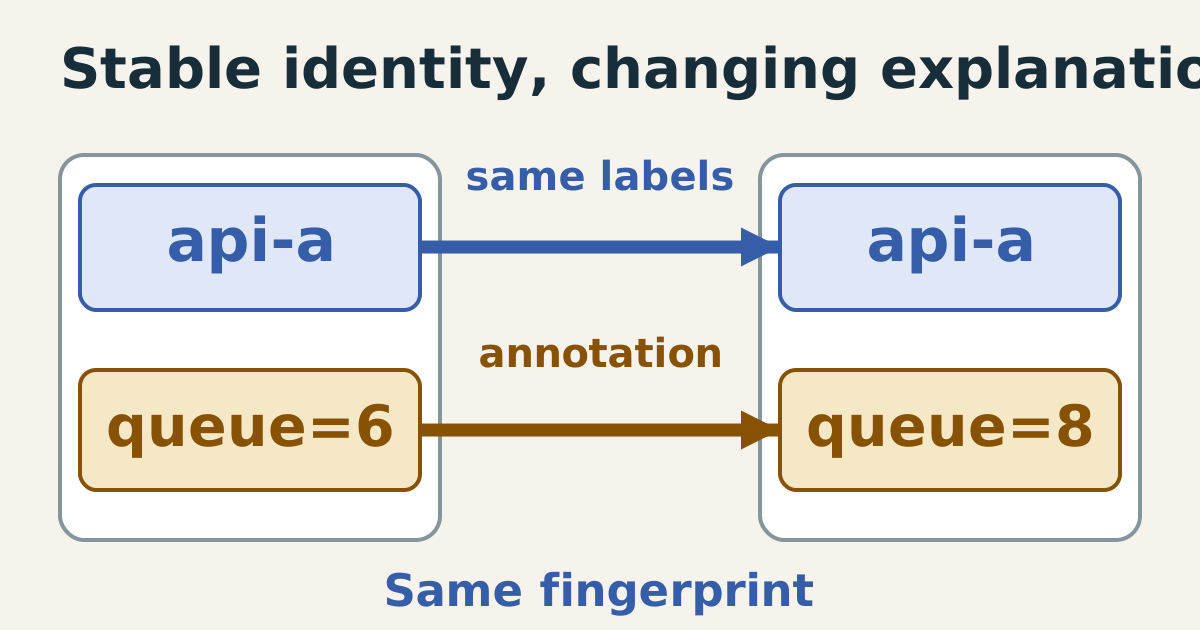
Labels identify alert instances. Keep stable routing dimensions, such as service, queue, and severity, in labels. Put changing explanatory values in annotations. If a label includes the current queue size, every change can create a different identity and restart the pending period. An annotation can include that size without redefining which alert is being tracked.
Waiting is measured at evaluations
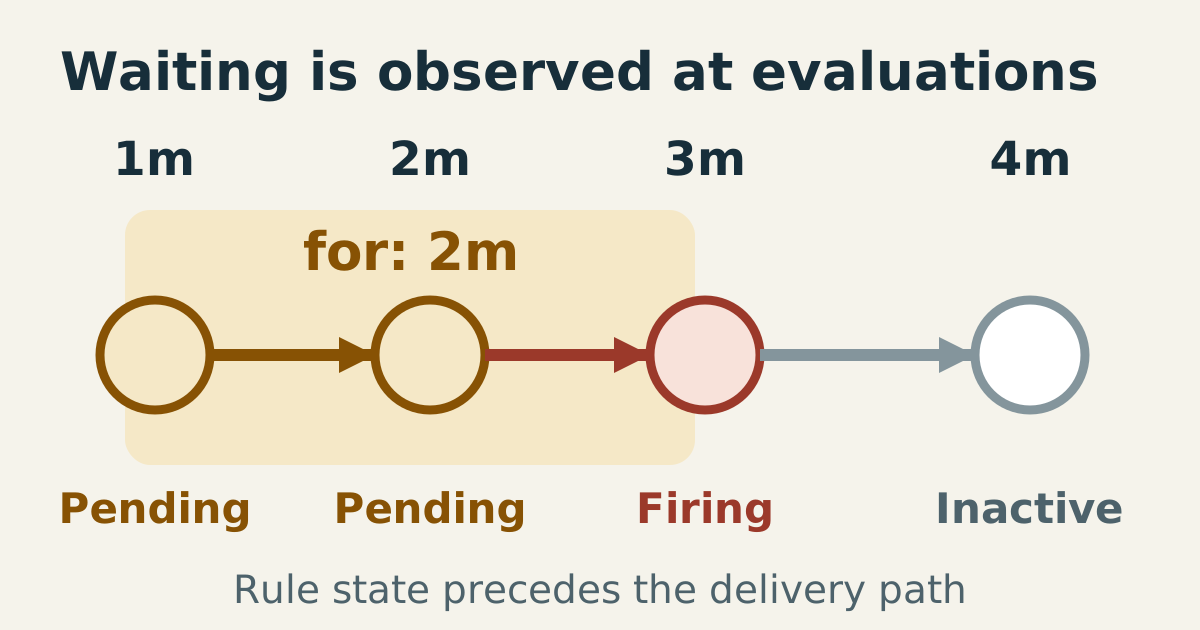
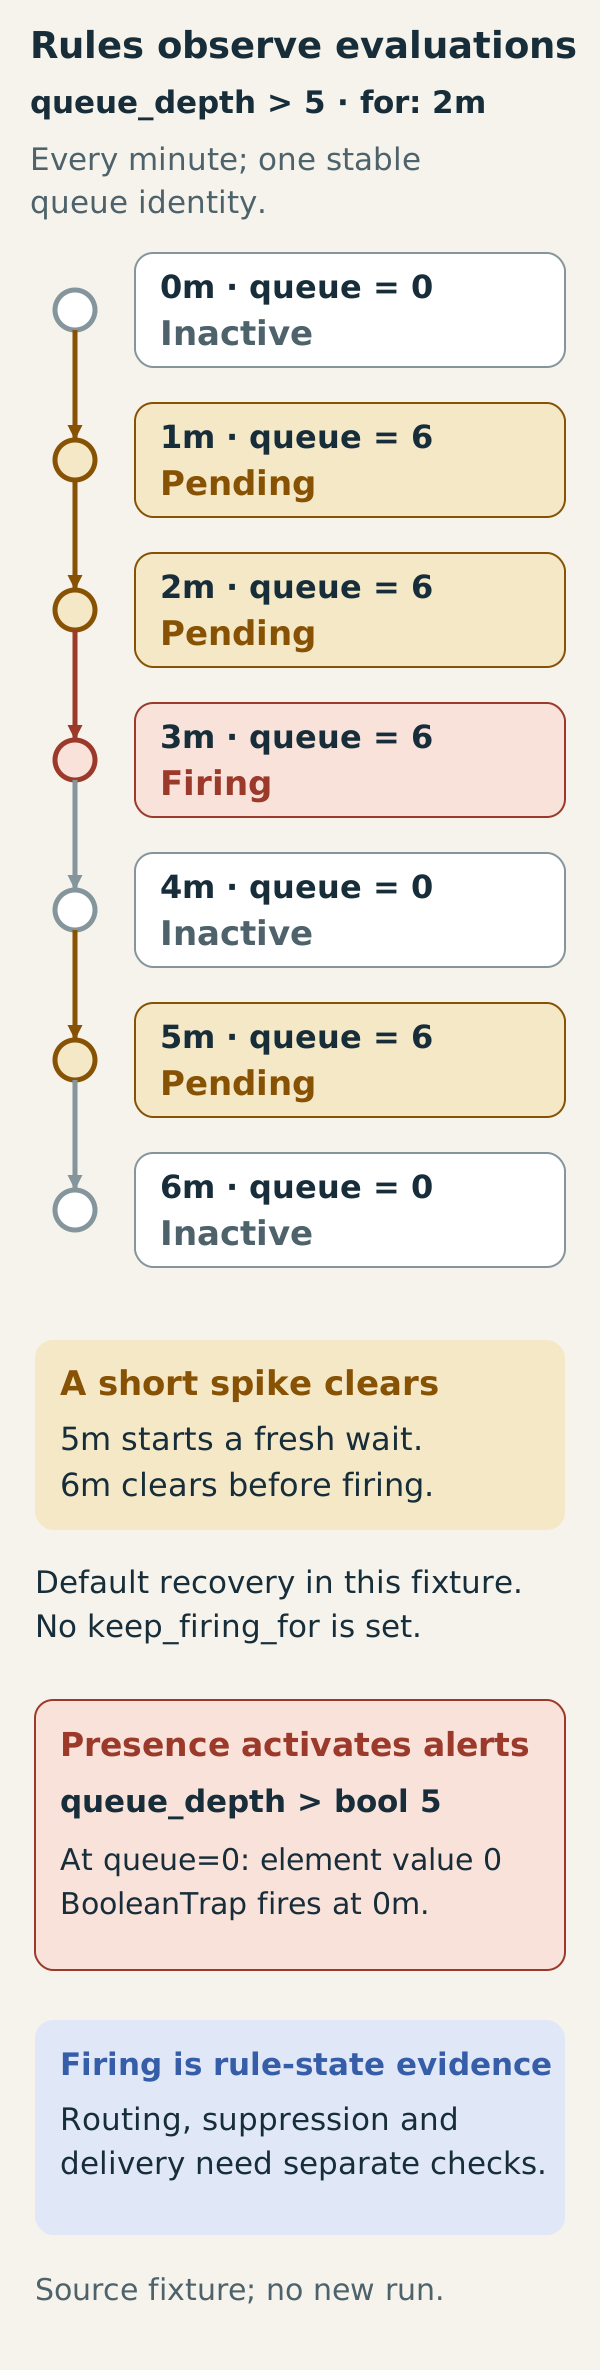
With for: 2m, a newly active label set is pending until it has remained active for two minutes of evaluated time. A rule evaluated every minute first seeing the condition at minute one can fire at minute three. The engine observes evaluations, not continuous physical reality between samples. The timing therefore includes the wait until the next evaluation as well as the configured duration.
Omitting for permits an active expression to fire on its first evaluation. That may suit an unequivocal failure, but it also makes a single bad sample sufficient; choose deliberately rather than relying on a forgotten default.
If the expression stops returning that label set before firing, pending state clears. With the default behavior used here, a firing alert also clears when its condition disappears. An explicitly configured keep_firing_for can extend firing after the condition clears; that option is not present in this example. Do not describe all alerts as latched incidents that require manual acknowledgement to resolve.
When it breaks
A threshold over a missing series usually returns nothing. That can clear an alert even though the application has stopped exporting data. Decide whether absence needs its own rule rather than blindly treating it as recovery. Test label changes and missing samples alongside threshold transitions. A syntax check alone cannot reveal these semantic failures.
A firing alert can produce no visible page because a silence, an inhibition rule, routing, grouping delay, or delivery failure intervened. These mechanisms belong to the notification path and do not change Prometheus’s threshold evaluation. Inspect the active alert labels and then the matching Alertmanager route and delivery evidence. Increasing for does not repair a wrong receiver or a missing route label.
Check it quickly
Save this as alert-state.py and run python3 alert-state.py with an installed promtool in PATH, or set PROMTOOL to its executable. This complete fixture passed with promtool 3.14.0 and Python 3.12.14. It evaluates actual rules locally, without Docker, a listener, Alertmanager, or an external notification destination.
from pathlib import Path
from tempfile import TemporaryDirectory
import os
import shutil
import subprocess

promtool = shutil.which(os.environ.get("PROMTOOL", "promtool"))
if promtool is None:
    raise SystemExit("Set PROMTOOL to an installed promtool executable")
promtool = str(Path(promtool).resolve())
tests = r"""evaluation_interval: 1m
rule_files:
  - rules.yml
tests:
  - interval: 1m
    input_series:
      - series: "queue_depth{queue=\"orders\"}"
        values: "0 6 6 6 0 6 0 0"
    promql_expr_test:
      - expr: 'sum(ALERTS{alertname="BooleanTrap",alertstate="firing"}) or vector(0)'
        eval_time: 0m
        exp_samples:
          - labels: "{}"
            value: 1
      - expr: "sum(ALERTS{alertname=\"QueueBacklog\",alertstate=\"pending\"}) or vector(0)"
        eval_time: 1m
        exp_samples:
          - labels: "{}"
            value: 1
      - expr: "sum(ALERTS{alertname=\"QueueBacklog\",alertstate=\"firing\"}) or vector(0)"
        eval_time: 2m
        exp_samples:
          - labels: "{}"
            value: 0
      - expr: "sum(ALERTS{alertname=\"QueueBacklog\",alertstate=\"firing\"}) or vector(0)"
        eval_time: 3m
        exp_samples:
          - labels: "{}"
            value: 1
      - expr: "sum(ALERTS{alertname=\"QueueBacklog\"}) or vector(0)"
        eval_time: 4m
        exp_samples:
          - labels: "{}"
            value: 0
      - expr: "sum(ALERTS{alertname=\"QueueBacklog\",alertstate=\"pending\"}) or vector(0)"
        eval_time: 5m
        exp_samples:
          - labels: "{}"
            value: 1
      - expr: "sum(ALERTS{alertname=\"QueueBacklog\"}) or vector(0)"
        eval_time: 6m
        exp_samples:
          - labels: "{}"
            value: 0
  - interval: 1m
    input_series:
      - series: 'queue_depth{queue="orders"}'
        values: "6 6 stale"
    promql_expr_test:
      - expr: 'sum(ALERTS{alertname="QueueBacklog"}) or vector(0)'
        eval_time: 2m
        exp_samples:
          - labels: "{}"
            value: 0
"""
rules = r"""groups:
  - name: queue-alerts
    interval: 1m
    rules:
      - alert: QueueBacklog
        expr: queue_depth{queue="orders"} > 5
        for: 2m
        labels:
          severity: page
        annotations:
          summary: Orders queue remains above five
      - alert: BooleanTrap
        expr: queue_depth{queue="orders"} > bool 5
        annotations:
          summary: Deliberately incorrect boolean alert for this test
"""
with TemporaryDirectory(prefix="prom-rule-test-") as directory:
    work = Path(directory)
    (work / "tests.yml").write_text(tests, encoding="utf-8")
    (work / "rules.yml").write_text(rules, encoding="utf-8")
    subprocess.run([promtool, "test", "rules", "tests.yml"], cwd=work,
                   check=True, timeout=45)
The expected output is SUCCESS. At minute one the alert is pending, at minute two it is not firing, and at minute three it fires. At minute four the condition recovers and no active ALERTS element remains. A second spike starts pending at minute five but clears at minute six, so it never reaches firing.
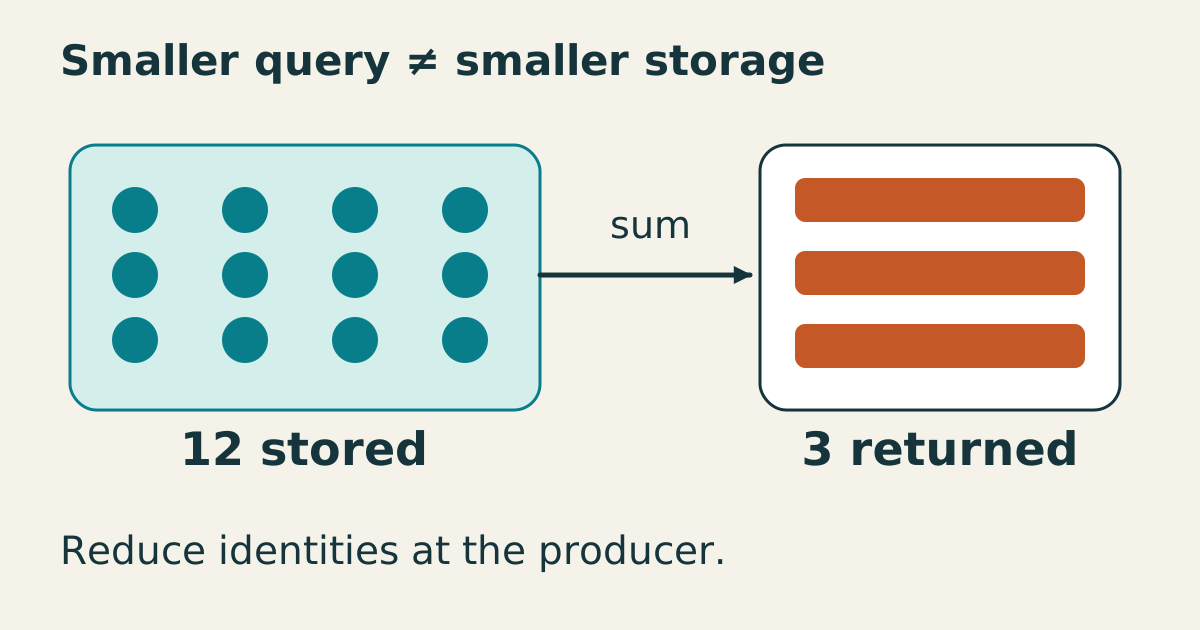
The assertions inspect the synthetic ALERTS series; their or vector(0) only makes absence countable inside the test. It is not part of the production alert expression. A deliberately wrong BooleanTrap rule fires even at minute zero, when the comparison is false. A separate stale-marker fixture clears pending state before firing; this tests explicit staleness, not every scrape-failure timeline. Temporary rule files are removed after execution. These checks verify the supplied timelines. Receiver matching, grouping delays, and actual message delivery require separate tests with the intended Alertmanager configuration.
Sources
- Prometheus: alerting rules, active label sets, for and synthetic ALERTS series, checked 2026-10-15.
- Prometheus: unit testing rules, evaluation timelines and assertion fixtures, checked 2026-10-15.
- Prometheus: Alertmanager, notification grouping, routing, silences and inhibition, checked 2026-10-15.