Repeated service-level queries are good candidates for recording rules when their cost and reuse justify precomputation. The design question is what to store. Saving only an instance’s error percentage can discard the traffic volume needed for later aggregation. Saving error rates and request rates preserves the numerator and denominator, allowing consumers to calculate a correctly weighted service fraction.
A percentage needs its population
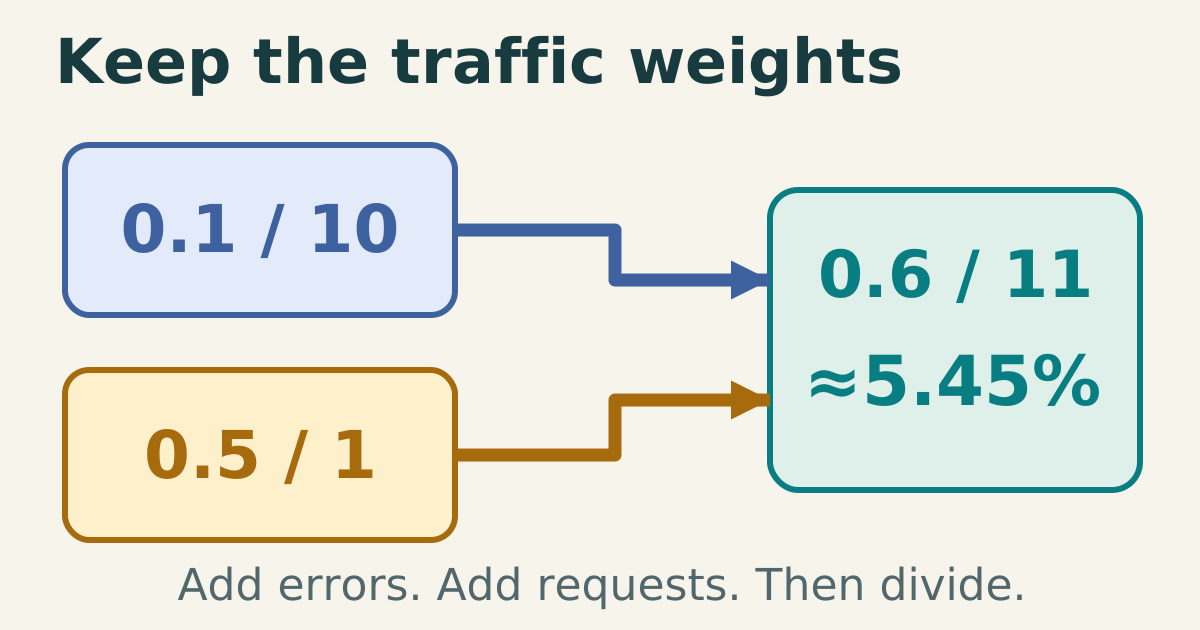
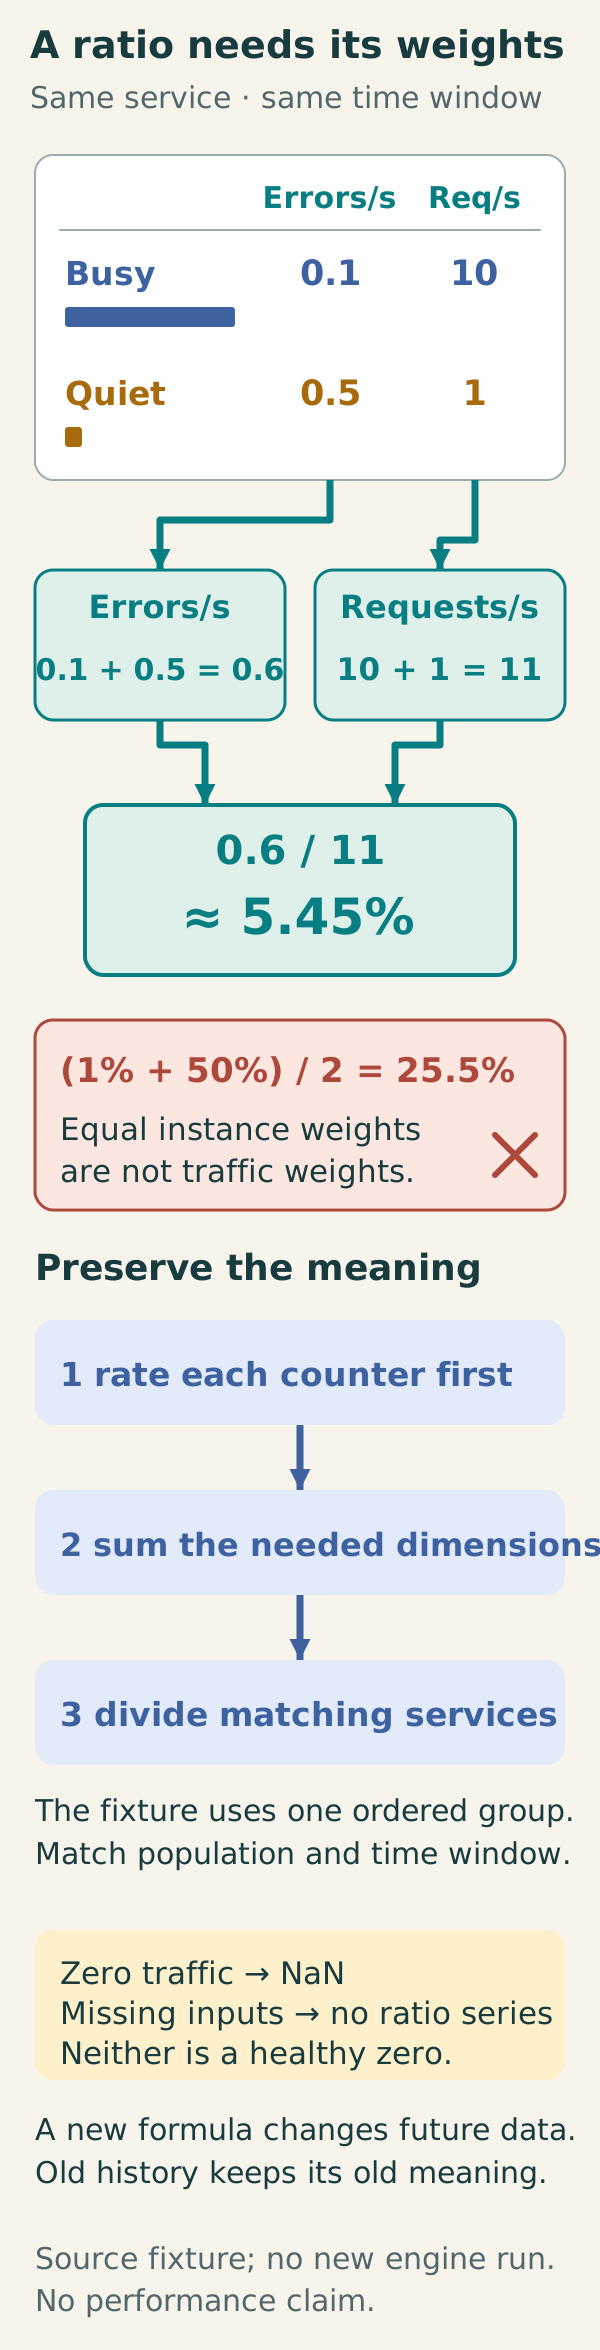
Suppose a busy instance handles ten requests per second with 0.1 errors per second. A quiet instance handles one request per second with 0.5 errors per second. Their individual error fractions are one percent and fifty percent. Averaging those fractions gives 25.5 percent, which weights instances equally even though their request volumes differ by a factor of ten.
The service sees eleven requests and 0.6 errors per second. Its error fraction is 0.6/11, approximately 5.45 percent. This is the ratio of aggregate errors to aggregate requests. Both measurements must describe the same eligible traffic population and time window. A faster dashboard is still wrong if its numerator excludes failures that its denominator includes, or the two sides aggregate different services.
Build the rule dependency in order
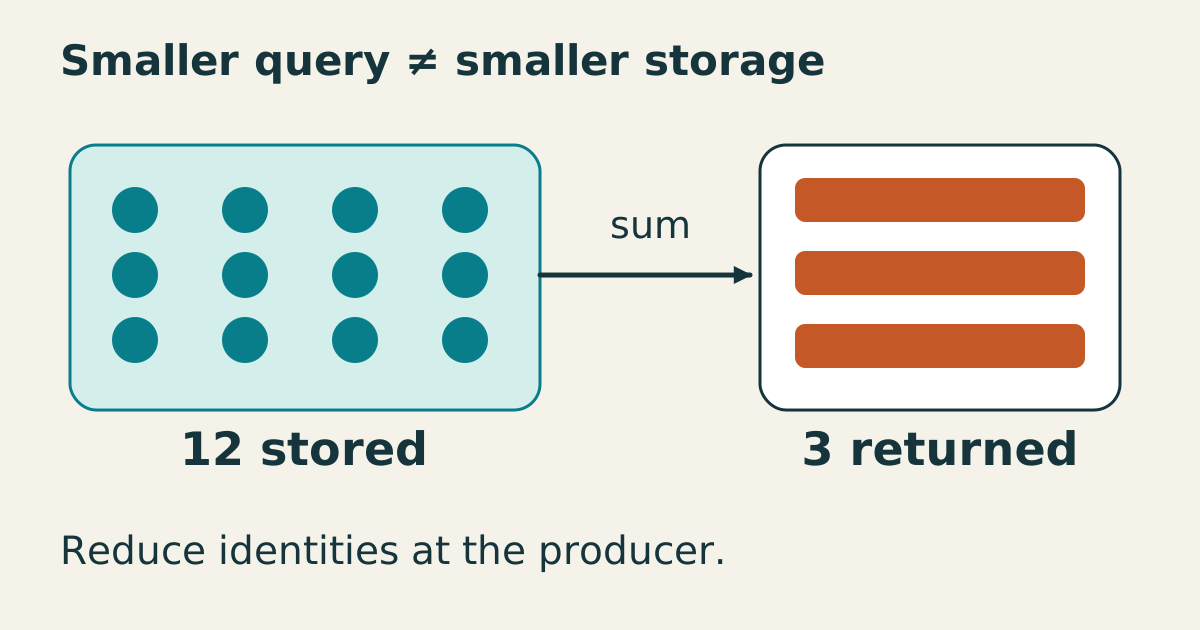
Start with rate on each counter series so observed resets are handled before aggregation. Then sum by the dimensions consumers actually need. The example first records request rates by service and instance, then service request rates, service error rates, and finally the service error fraction. The intermediate instance rate is included to demonstrate an explicit dependency consumed by a later rule.
All four rules share a group and run in declaration order with the same evaluation time. Matching service labels on numerator and denominator make their division pair the intended series. A denominator retaining an extra instance label would change vector matching and could remove results or require a different join. Test the actual output labels as well as the numeric answer.
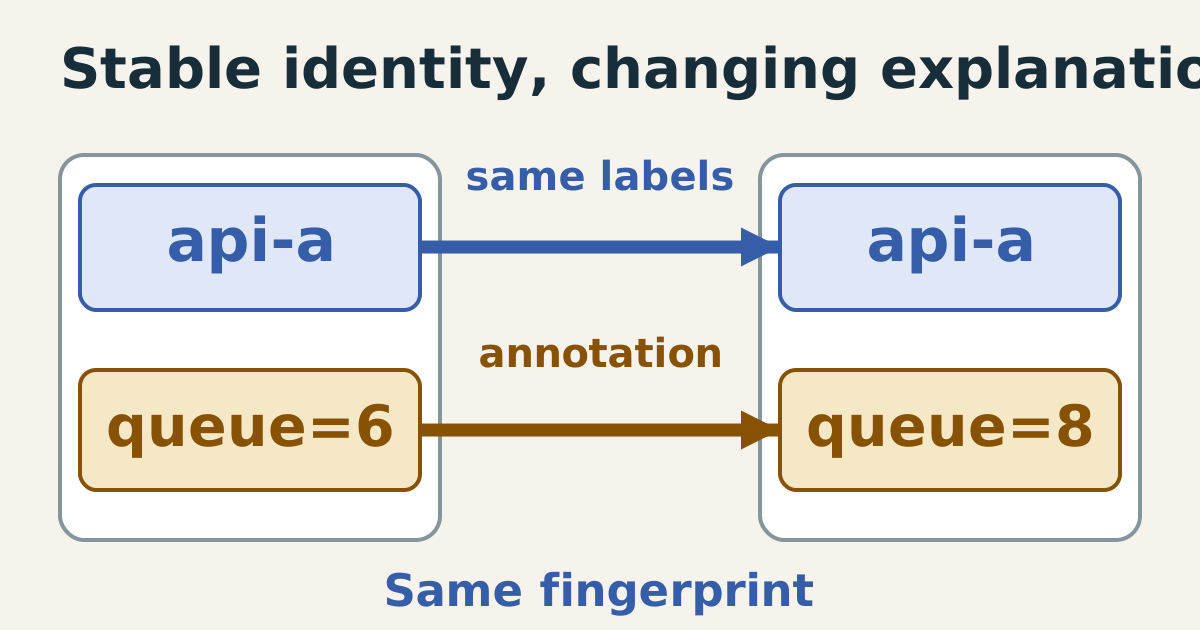
Keep names descriptive about aggregation level and range. A two-minute rate and a thirty-minute rate are different quantities even when their current values happen to match. Record the eligible event definition beside the rule and identify which dashboards or alerts consume it. Changing the formula under a stable name changes future samples, not the meaning of already stored history.
When it breaks
An average of percentages can make a small failing replica dominate a fleet report or conceal a busy failing replica. Increasing the evaluation frequency does not repair that arithmetic. Recover the underlying counts or rates and divide after aggregation. Once only percentages remain, the original traffic weights generally cannot be reconstructed from those percentages alone.
Zero traffic is another distinct case. A zero denominator does not define a zero error fraction, and a missing numerator may mean absent instrumentation rather than no errors. Decide those semantics explicitly with the metric contract. Avoid automatically filling every empty or undefined result with a healthy zero. Validate that errors are exported consistently, including during healthy operation.
Check it quickly
Save this as recording-weighted.py and run python3 recording-weighted.py with an installed promtool in PATH, or set PROMTOOL to its executable. The retained 2026-10-15 review records a pass with promtool 3.14.0 and Python 3.12.14; this source review did not rerun the rule engine. The actual rule engine evaluates synthetic minute-spaced counters with deliberately unequal traffic weights, plus separate zero-traffic and missing-series cases.
from pathlib import Path
from tempfile import TemporaryDirectory
import os
import shutil
import subprocess

promtool = shutil.which(os.environ.get("PROMTOOL", "promtool"))
if promtool is None:
    raise SystemExit("Set PROMTOOL to an installed promtool executable")
promtool = str(Path(promtool).resolve())
tests = r"""evaluation_interval: 1m
rule_files:
  - rules.yml
tests:
  - interval: 1m
    input_series:
      - series: "http_requests_total{service=\"checkout\",instance=\"busy\"}"
        values: "0+600x5"
      - series: "http_errors_total{service=\"checkout\",instance=\"busy\"}"
        values: "0+6x5"
      - series: "http_requests_total{service=\"checkout\",instance=\"quiet\"}"
        values: "0+60x5"
      - series: "http_errors_total{service=\"checkout\",instance=\"quiet\"}"
        values: "0+30x5"
    promql_expr_test:
      - expr: "service:http_requests:rate2m"
        eval_time: 5m
        exp_samples:
          - labels: "{__name__=\"service:http_requests:rate2m\",service=\"checkout\"}"
            value: 11
      - expr: "abs(service:http_errors:rate2m - 0.6) < bool 1e-12"
        eval_time: 5m
        exp_samples:
          - labels: "{service=\"checkout\"}"
            value: 1
      - expr: "abs(service:http_errors:ratio_rate2m - 0.6/11) < bool 1e-12"
        eval_time: 5m
        exp_samples:
          - labels: "{service=\"checkout\"}"
            value: 1
      - expr: "abs(avg(rate(http_errors_total[2m]) / rate(http_requests_total[2m])) - 0.255) < bool 1e-12"
        eval_time: 5m
        exp_samples:
          - labels: "{}"
            value: 1
  - interval: 1m
    input_series:
      - series: 'http_requests_total{service="idle",instance="one"}'
        values: "0+0x5"
      - series: 'http_errors_total{service="idle",instance="one"}'
        values: "0+0x5"
    promql_expr_test:
      - expr: 'count(service:http_errors:ratio_rate2m != service:http_errors:ratio_rate2m)'
        eval_time: 5m
        exp_samples:
          - labels: "{}"
            value: 1
  - interval: 1m
    input_series: []
    promql_expr_test:
      - expr: 'count(service:http_errors:ratio_rate2m) or vector(0)'
        eval_time: 5m
        exp_samples:
          - labels: "{}"
            value: 0
"""
rules = r"""groups:
  - name: service-rates
    interval: 1m
    rules:
      - record: instance:http_requests:rate2m
        expr: sum by (service, instance) (rate(http_requests_total[2m]))
      - record: service:http_requests:rate2m
        expr: sum by (service) (instance:http_requests:rate2m)
      - record: service:http_errors:rate2m
        expr: sum by (service) (rate(http_errors_total[2m]))
      - record: service:http_errors:ratio_rate2m
        expr: service:http_errors:rate2m / service:http_requests:rate2m
"""
with TemporaryDirectory(prefix="prom-rule-test-") as directory:
    work = Path(directory)
    (work / "tests.yml").write_text(tests, encoding="utf-8")
    (work / "rules.yml").write_text(rules, encoding="utf-8")
    subprocess.run([promtool, "test", "rules", "tests.yml"], cwd=work,
                   check=True, timeout=45)
The expected output is SUCCESS. The recorded request rate is eleven, the error rate is 0.6, and the resulting fraction is 0.6/11. A separate assertion demonstrates that the incorrect average of instance fractions is 0.255. Numerical comparisons use a small tolerance where floating-point division is involved, and label assertions retain the checkout service identity.
The zero-traffic fixture produces NaN: its ratio differs from itself, so the filtering comparison retains one series. Missing inputs produce no ratio series instead. Neither becomes a healthy zero. This local rule test starts no listener and removes its temporary files. It is not a performance benchmark or proof of complete instrumentation. Add service-specific reset and ingestion-delay cases, then measure query cost and rule duration before claiming operational benefit.
Sources
- Prometheus: recording rules, ordered rule dependencies and stored output, checked 2026-10-15.
- Prometheus: query functions, rate before aggregation for counter resets, checked 2026-10-15.
- Prometheus: unit testing rules, testing recorded series and PromQL results, checked 2026-10-15.