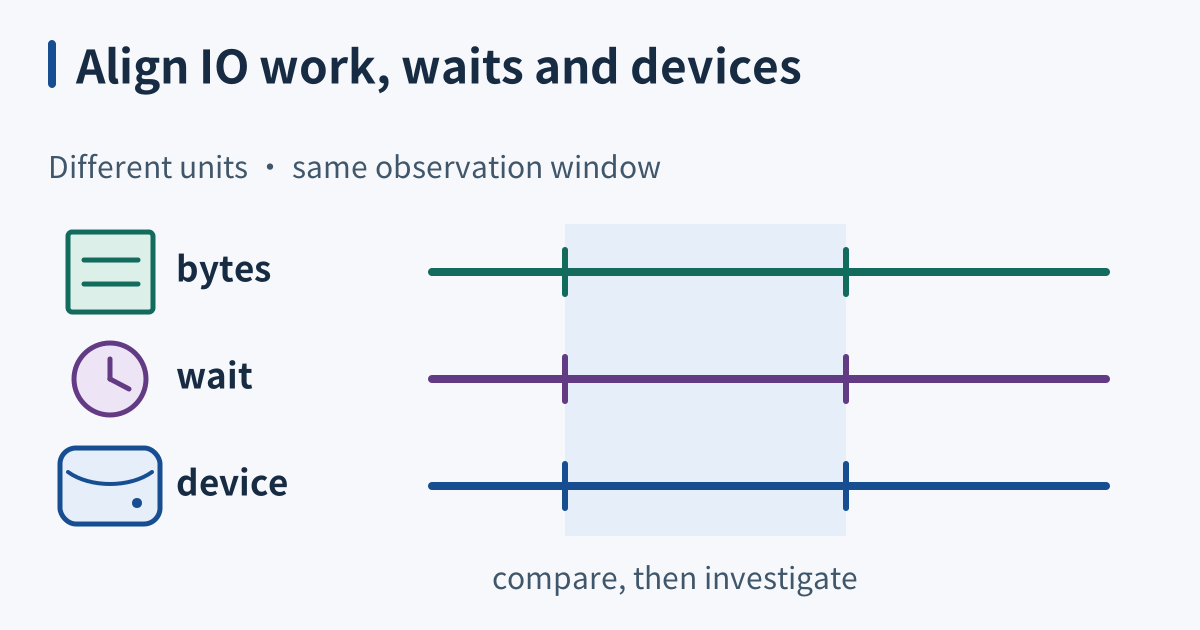
Three distinct task-byte, task-wait and device lanes share an observation window without identifying a proven culprit.

iotop shows which process is burning the disks

iotop connects task-level kernel accounting with a system-wide storage investigation. It can identify tasks reporting substantial IO or waiting, but those are different observations. A task blocked behind other work may be a victim rather than the source of contention. Kernel counters do not provide perfect attribution for every filesystem, cache, or storage layer. ...
March 15, 2028 · 6 min · XB Field Notes
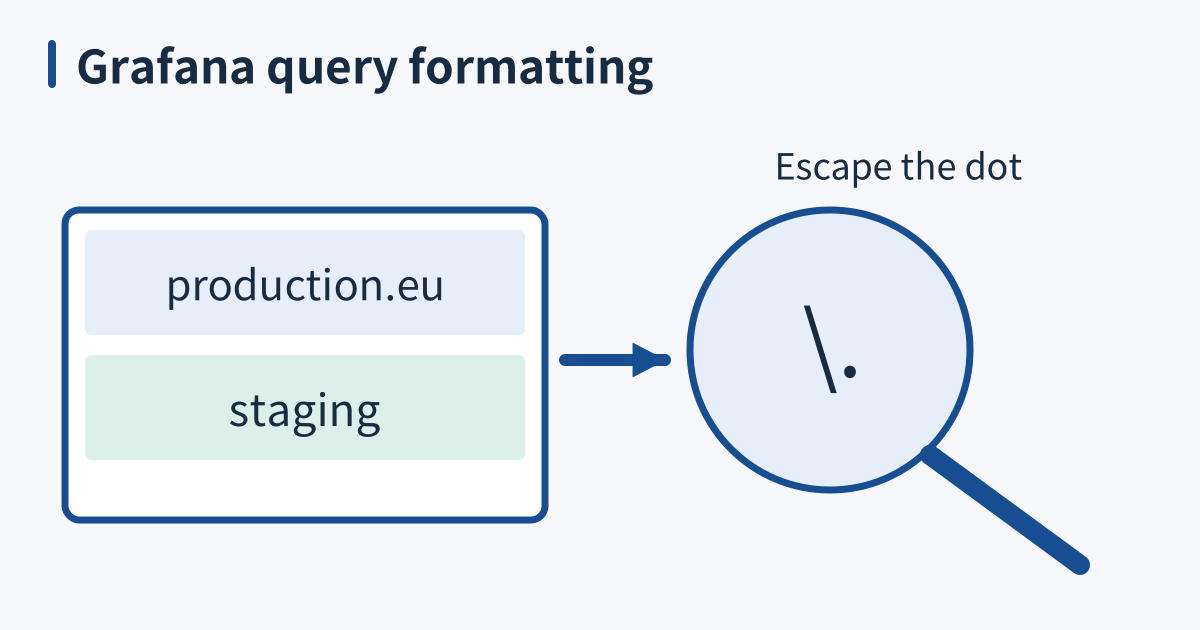
The production.eu and staging selections feed a magnified escaped literal dot, emphasizing regex formatting.

Grafana variables need the query language to agree

Grafana dashboard variables let one dashboard select an environment, service, or instance without duplicating every panel. A query variable obtains options from a data source; a custom variable can hold a deliberately fixed list. Neither choice is universally better. Use query-backed options when discovery should follow the source, and a maintained static list when the allowed choices are intentionally stable and small. ...

February 23, 2028 · 8 min · XB Field Notes
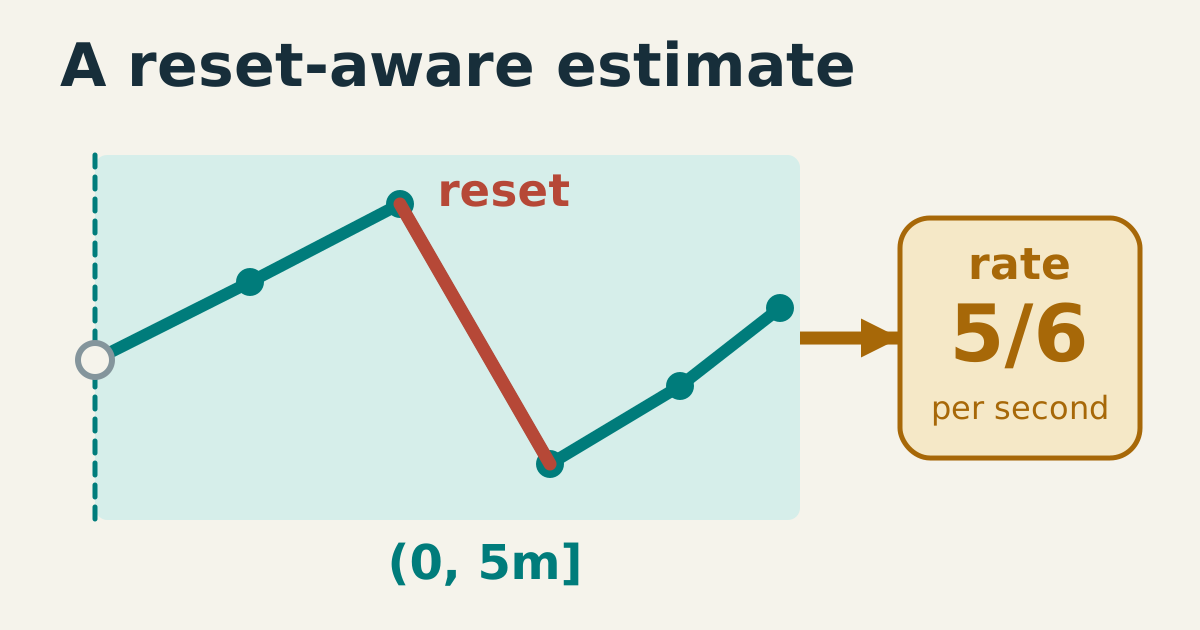
The article’s counter samples rise, reset sharply, and rise again inside a five-minute range. The first sample is outside the left-open boundary. An arrow leads from selected observations to the source fixture’s rate estimate, 5/6 per second.

Prometheus rate estimates counter growth per second

A request counter answers how many events an instrumented process has accumulated. A rate answers how quickly those events are arriving. Prometheus rate estimates average growth per second over a selected range, adjusts observed counter resets, and extrapolates toward the range boundaries. The result is useful precisely because it has a time unit, but it is not an exact reconstruction of every event between scrapes. ...

December 24, 2027 · 5 min · XB Field Notes
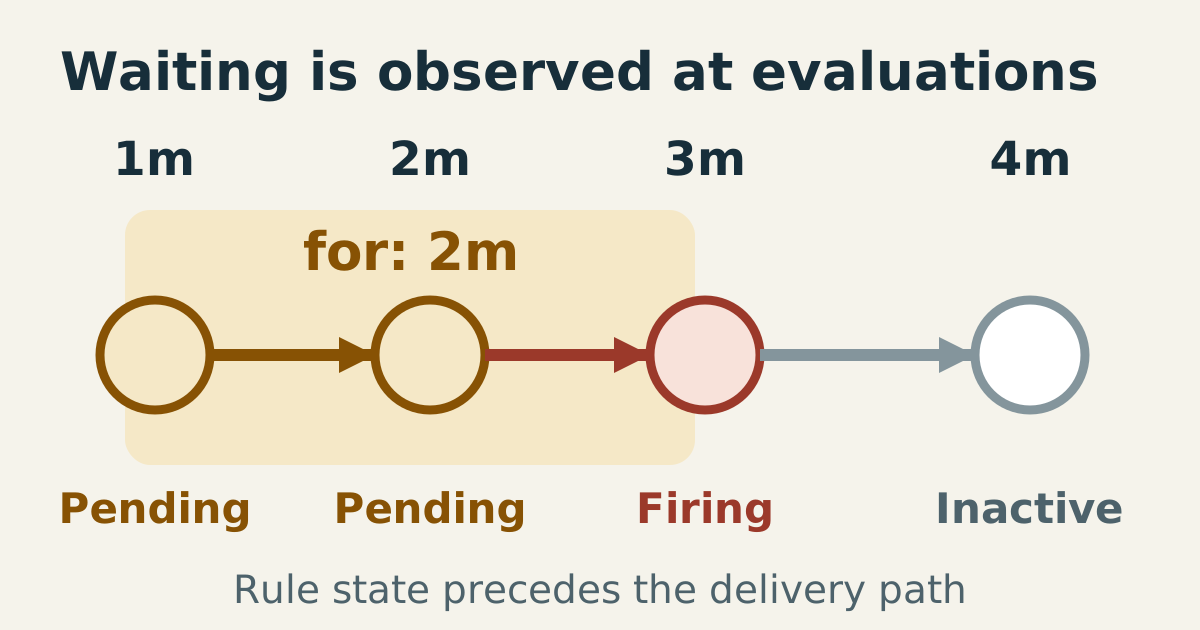
A gold pending interval begins at minute one, reaches a red firing state at minute three after two evaluated minutes, then becomes inactive at minute four. These are rule states, before notification delivery.

Prometheus rules track alert state before notification delivery

An alerting rule evaluates a PromQL expression and tracks the returned label sets over time. Prometheus decides whether each resulting alert is pending or firing. Alertmanager receives alert information and handles notification routing, grouping, silencing, and inhibition. A reliable investigation follows those stages separately: a firing alert is evidence of rule state, not proof that a person received a message. ...

September 1, 2027 · 5 min · XB Field Notes
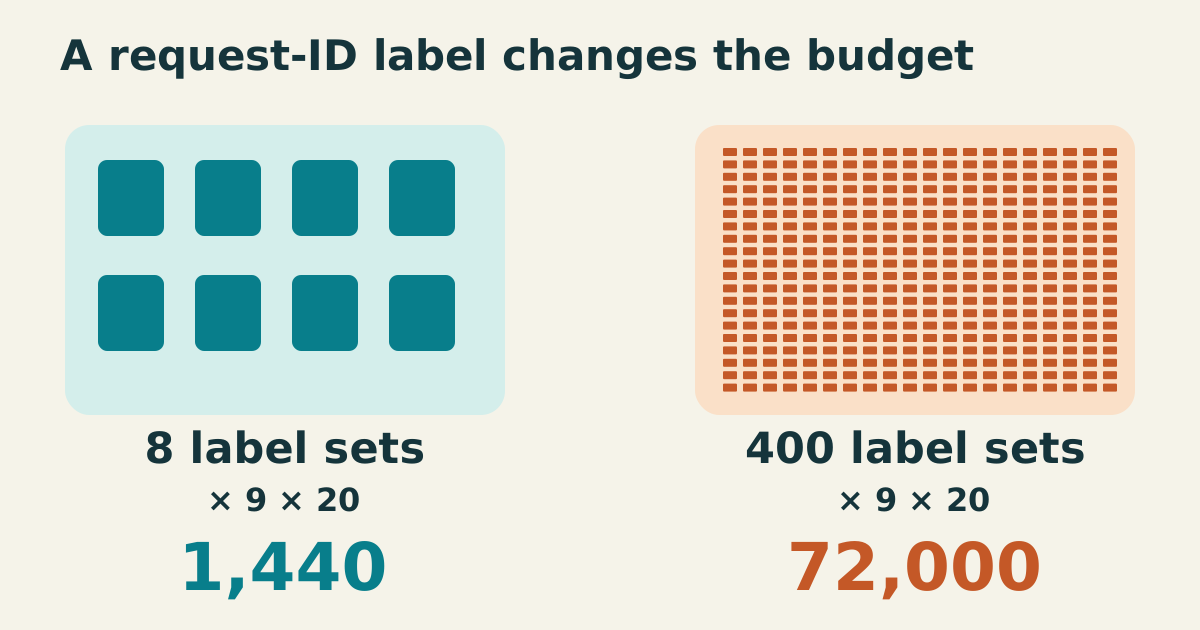
Eight large bounded-label tiles contrast with a dense grid of four hundred request-ID labels; the same nine-component and twenty-replica factors produce 1,440 versus 72,000 series.

Cardinality is a metric budget

A metric costs more than its short name suggests. Prometheus identifies a time series by its metric name and complete label set. A new observed label combination creates a different series, which must be ingested, indexed, retained, and queried. Cardinality budgeting asks which distinctions are worth paying for and whether their number stays bounded as the service grows. ...

July 21, 2027 · 4 min · XB Field Notes
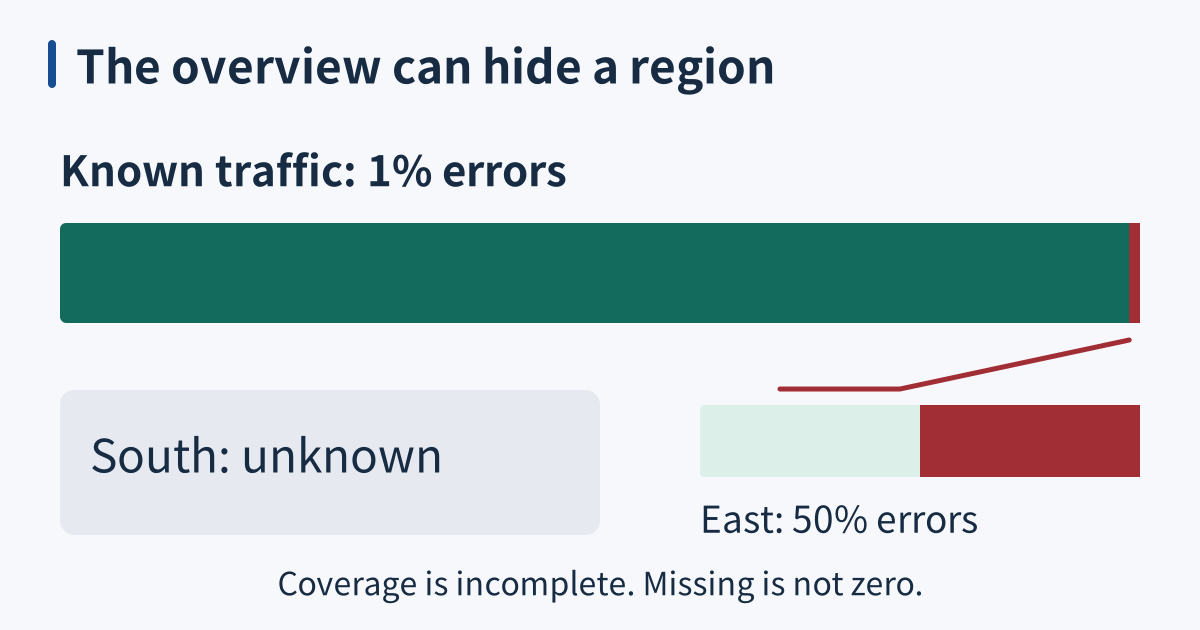
A known-traffic bar shows 1% errors; a regional enlargement shows 50% errors in the east. A separate gray area marks south unknown, so coverage is incomplete.

Dashboards summarize; they do not magnify

A useful dashboard helps a reader decide what to inspect next. It reduces a large collection of measurements into a small set of questions: are users succeeding, where is the impact, and is capacity becoming constrained? Reduction must preserve important differences. A green global percentage can conceal a failing region, and a blank panel can mean missing telemetry rather than a quiet, healthy service. ...

July 18, 2027 · 5 min · XB Field Notes
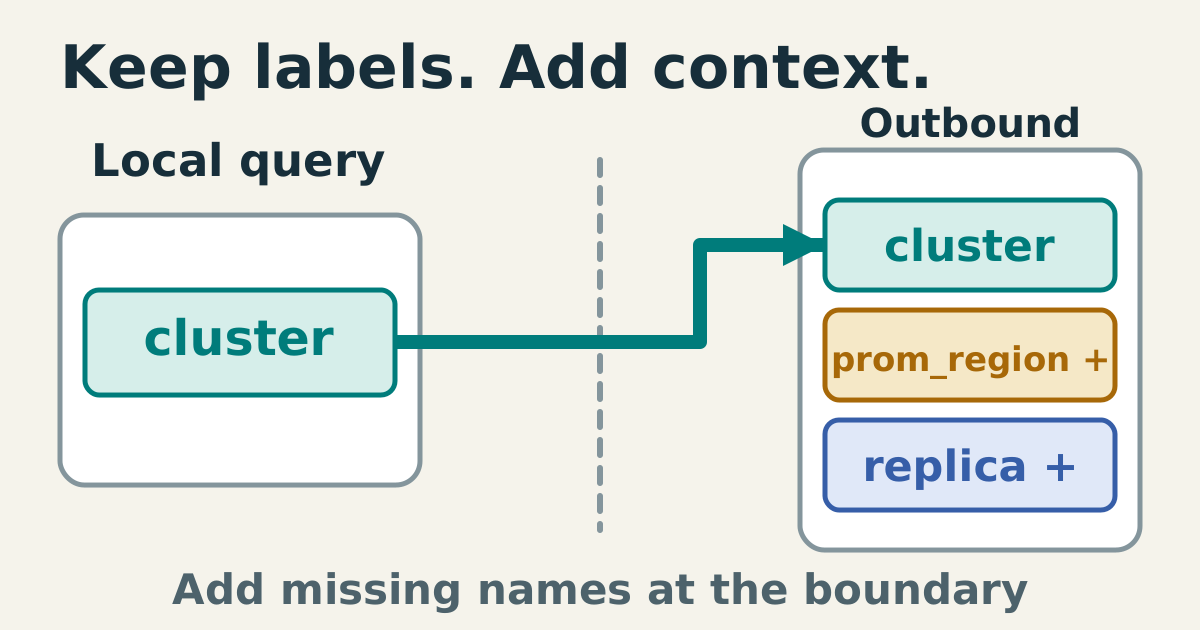
A local series with one existing cluster label crosses an outbound communication boundary. The same cluster label remains on the outgoing series while two differently colored missing-label slots are added.

External labels identify outgoing Prometheus data

When several Prometheus servers send data to a common system, downstream readers need to know which collector or environment supplied it. Global external_labels can add that context during communication with external systems. They do not rewrite every locally stored series, and they do not override labels already present on the outgoing series. Understanding both boundaries prevents misleading configuration checks. ...

June 9, 2027 · 5 min · XB Field Notes
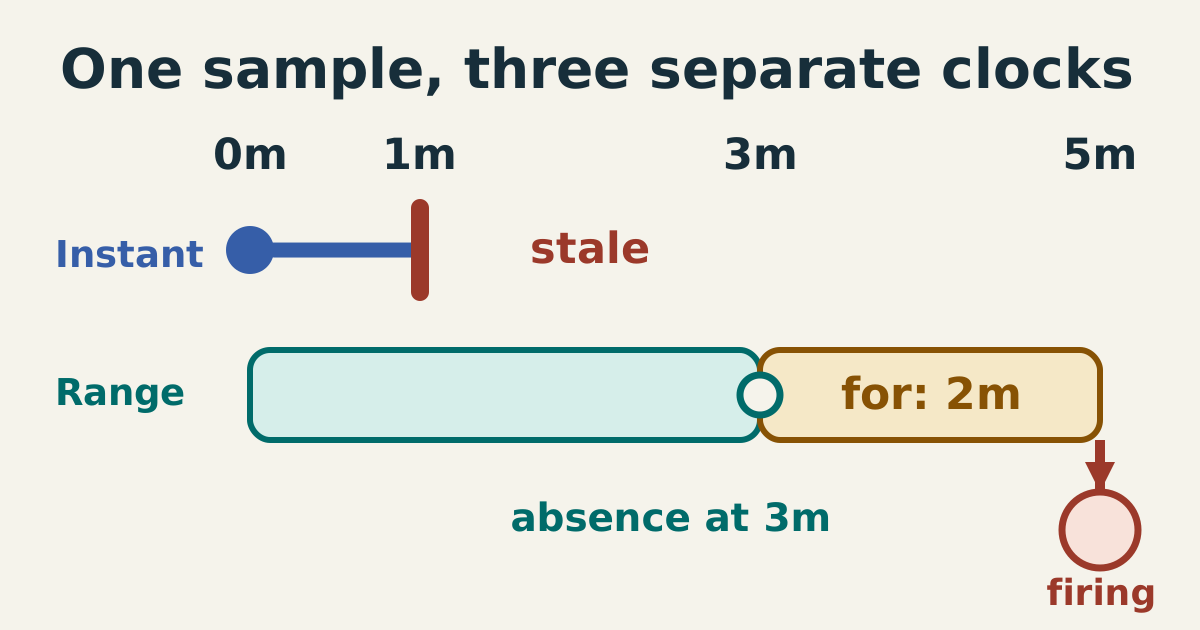
The source’s sample appears at minute zero. A stale marker stops instant selection at minute one, while the prior sample can remain in a three-minute range. Range absence begins at minute three; the separate two-minute alert wait reaches firing at minute five.

Prometheus staleness and alert waiting are different mechanisms

A missing metric is not a numeric zero. Prometheus distinguishes a series with a recent value, a series marked stale, and a selector with no usable sample. Alerting then applies its own evaluation and waiting rules. Treating all these mechanisms as one universal grace period produces alerts that miss disappearing targets or report an outage without establishing what actually disappeared. ...

February 3, 2027 · 5 min · XB Field Notes