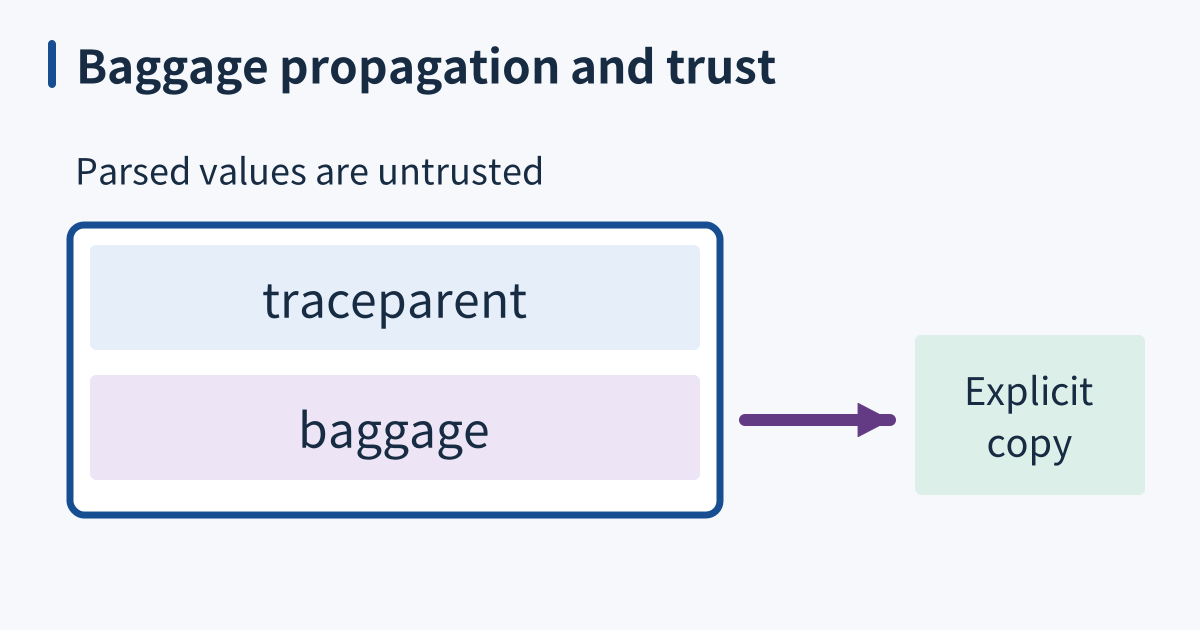
A carrier holds separate traceparent and baggage fields; baggage reaches recording only through explicit copying and remains untrusted input.

Baggage carries context across an explicit boundary

OpenTelemetry baggage is a context-associated collection of string key-value pairs. It lets information known near a request’s entry point travel to downstream operations: a deployment region or a rollout cohort, for example. Unlike a span attribute, baggage is intended for propagation. Unlike trace context, it describes application-selected information rather than the identifiers and flags connecting spans. These mechanisms can travel together without being the same data structure. ...
March 27, 2028 · 5 min · XB Field Notes
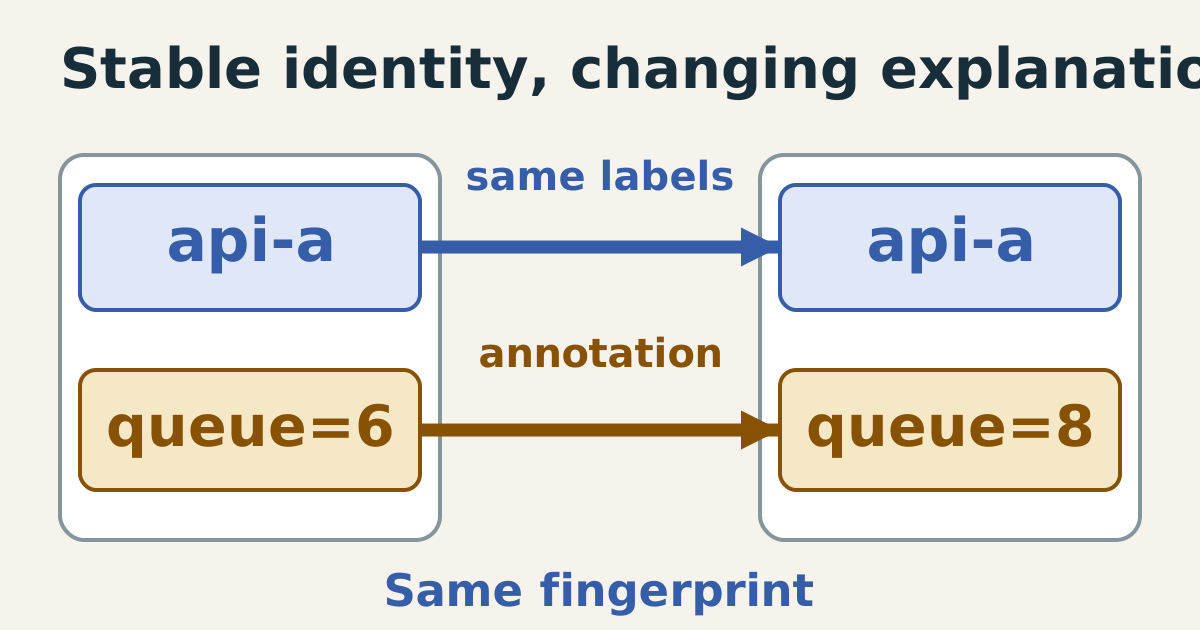
Two versions of the same api-a alert retain the same blue identity-label block and fingerprint while the gold annotation summary changes from queue six to queue eight. Only explanatory context changes.

Annotations explain an alert without changing its identity

Alert labels identify which condition is being tracked and provide fields for routing and grouping. Annotations explain that condition: a current value, a concise summary, or a runbook link. Putting changing prose in labels can split one ongoing problem into many identities. Putting routing fields only in annotations can leave a route unable to recognize the alert’s intended owner. ...

February 22, 2028 · 6 min · XB Field Notes
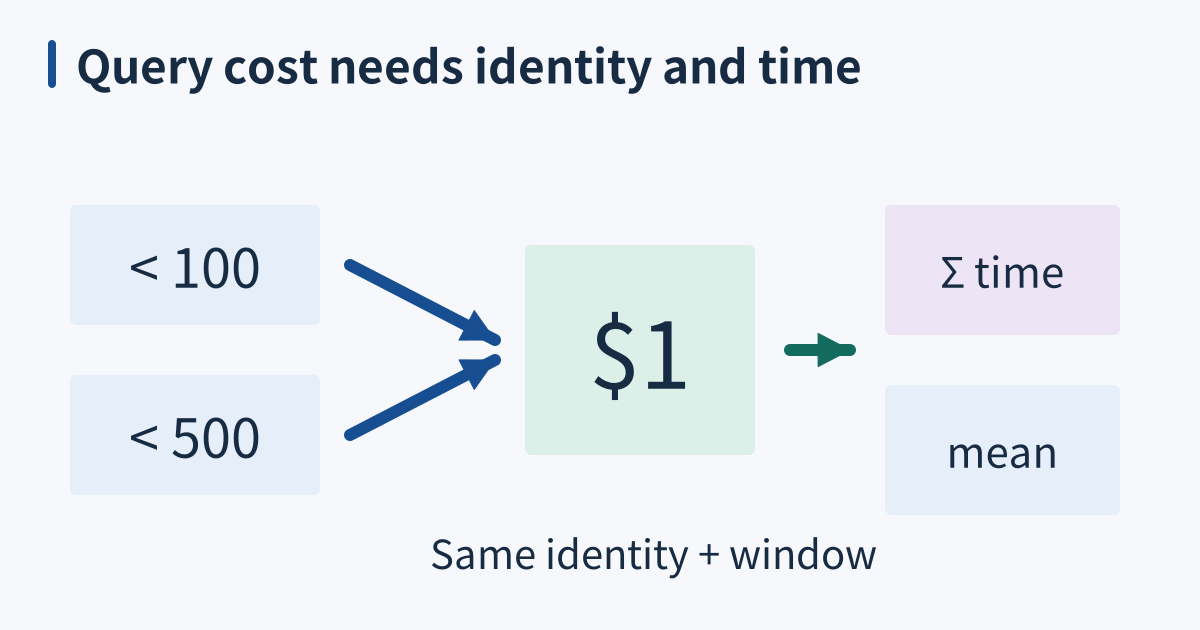
Two literal predicates converge into one parameterized shape, which feeds separate total-time and mean-time summaries within the same identity and collection window.

pg_stat_statements ranks query work within a collection window

pg_stat_statements groups statement executions and accumulates their costs. It can identify a frequently executed short query whose total time is substantial, as well as an individually slow query. These are different questions. Neither ranking alone proves which change will improve application latency, and execution time is not the same as CPU consumption, storage latency, or end-to-end request duration. ...

December 12, 2027 · 6 min · XB Field Notes
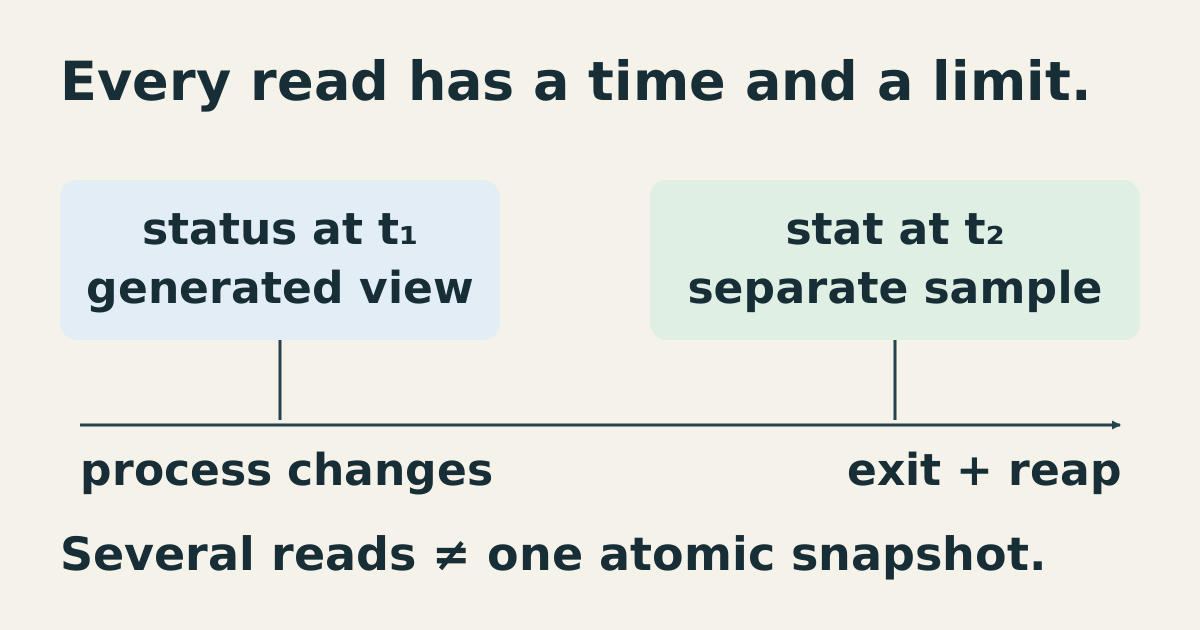
status at time one and stat at time two are separate reads of a changing process. After the controlled child exits and is reaped, its proc directory disappears; several reads do not form an atomic snapshot.

Read procfs as documented views of a changing process

Linux procfs exposes process and kernel information through filesystem interfaces. Many entries generate their contents when read instead of storing ordinary disk-file bytes. Each entry has a documented meaning, permission model, and format. Reading several entries does not freeze the process or create a transactionally consistent snapshot, so useful observations must be tied to the right process instance and interpretation. ...

October 29, 2027 · 5 min · XB Field Notes
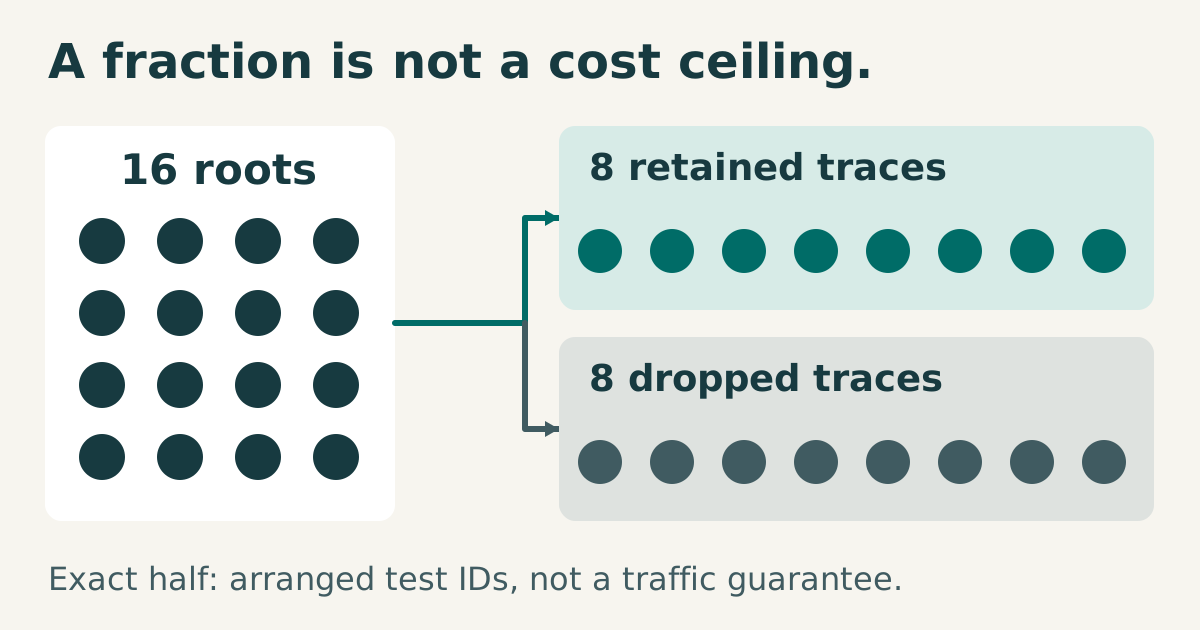
A controlled set of sixteen roots splits into eight retained traces and eight dropped traces. The sixteen-to-eight split belongs to arranged fixture identifiers; a configured sampling percentage is not a cost ceiling.

Trace sampling reduces volume without fixing a cost ceiling

Trace sampling selects which recorded work reaches the tracing pipeline. It can reduce export traffic and storage, but a configured percentage is not a strict ceiling on bytes, processor time, or money. Requests produce different numbers of spans, attributes vary in size, and traffic itself changes. A one-percent policy applied to a sudden tenfold traffic increase can still produce roughly ten times as much sampled data. ...

October 23, 2027 · 5 min · XB Field Notes
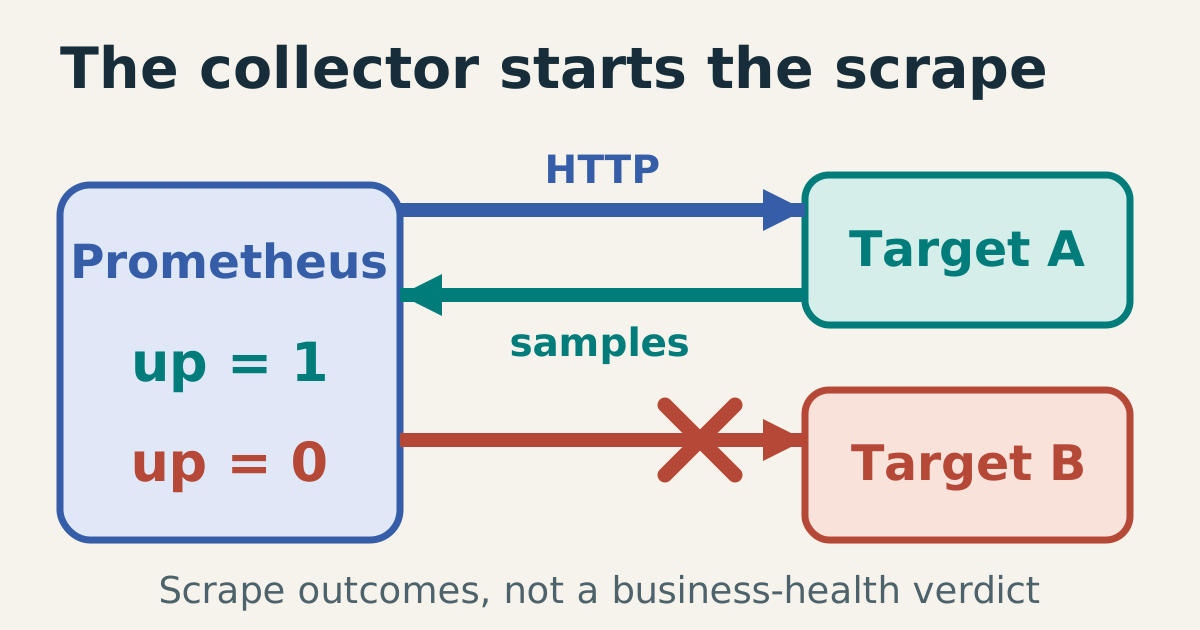
Prometheus initiates HTTP requests toward two target endpoints. A valid response returns samples and yields up=1; a refused scrape ends at a red stop and yields up=0. These are collection outcomes.

Prometheus pulls metrics and records scrape outcomes

Prometheus collects metrics by requesting an HTTP endpoint on each configured target. The target exposes observations; the collector chooses when to scrape, parses the response, and stores samples. This arrangement makes collection failures observable from the collector’s perspective. It does not guarantee that the endpoint is reachable, that every expected target was discovered, or that the application’s user journeys work. ...

August 30, 2027 · 5 min · XB Field Notes
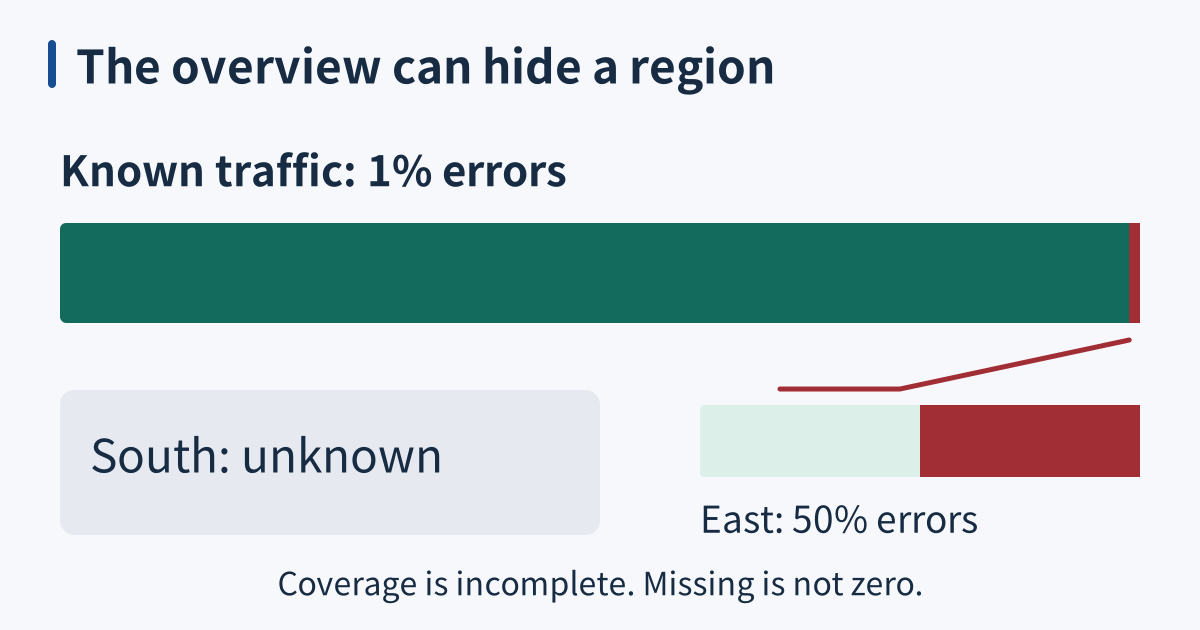
A known-traffic bar shows 1% errors; a regional enlargement shows 50% errors in the east. A separate gray area marks south unknown, so coverage is incomplete.

Dashboards summarize; they do not magnify

A useful dashboard helps a reader decide what to inspect next. It reduces a large collection of measurements into a small set of questions: are users succeeding, where is the impact, and is capacity becoming constrained? Reduction must preserve important differences. A green global percentage can conceal a failing region, and a blank panel can mean missing telemetry rather than a quiet, healthy service. ...

July 18, 2027 · 5 min · XB Field Notes
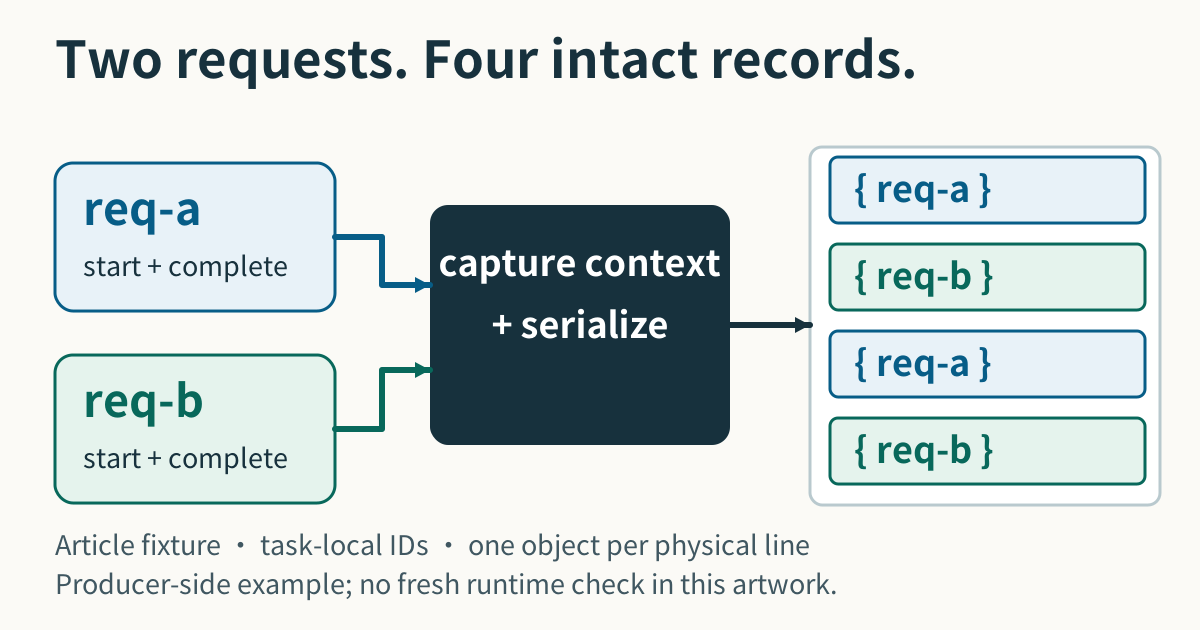
Two request lanes retain req-a and req-b through synchronous formatting into four separate JSON records. Article fixture illustration, not a new run.

Structured logs make their query contract explicit

Structured logging assigns stable meaning to fields instead of asking each query to infer everything from message text. A record might contain an event name, request identifier, numeric duration, severity, and a human-readable message. Free text remains useful and can also be searched or parsed. The practical gain is that routine questions can use a documented schema whose meaning survives changes to explanatory wording. ...

March 9, 2027 · 5 min · XB Field Notes