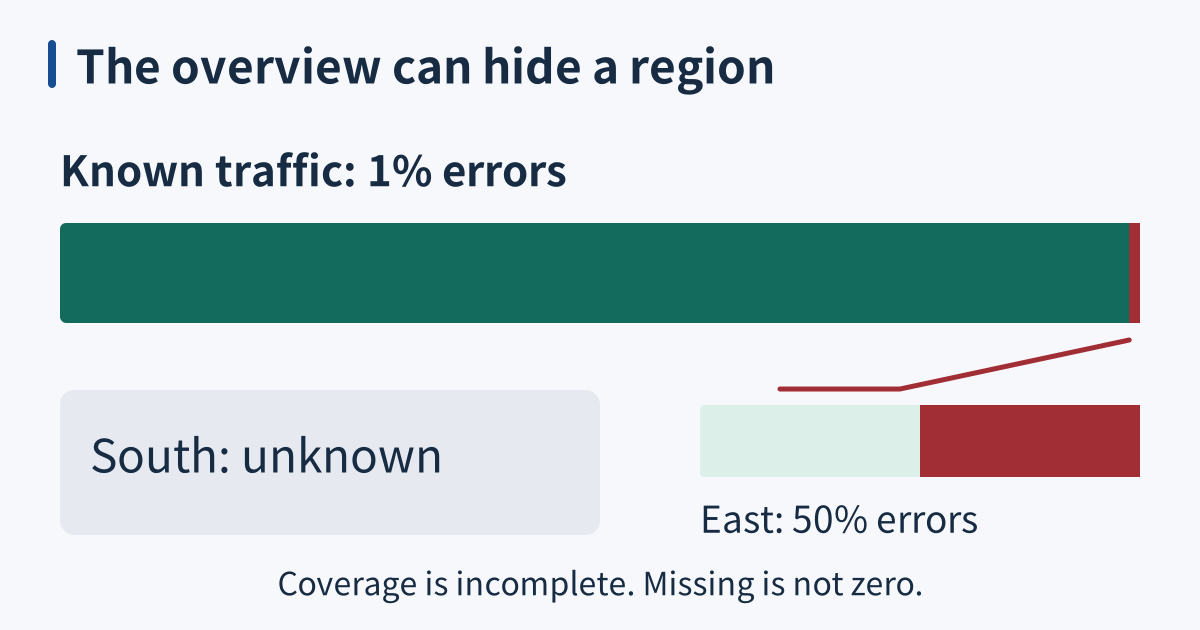
Dashboards summarize; they do not magnify
A useful dashboard helps a reader decide what to inspect next. It reduces a large collection of measurements into a small set of questions: are users succeeding, where is the impact, and is capacity becoming constrained? Reduction must preserve important differences. A green global percentage can conceal a failing region, and a blank panel can mean missing telemetry rather than a quiet, healthy service. ...