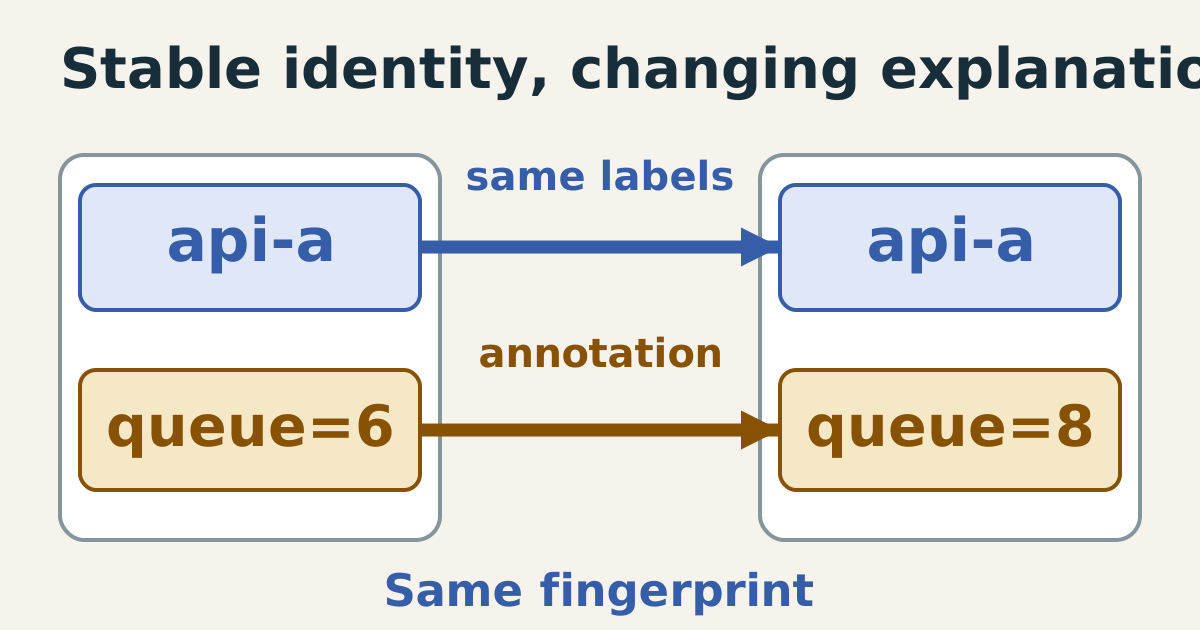
Two versions of the same api-a alert retain the same blue identity-label block and fingerprint while the gold annotation summary changes from queue six to queue eight. Only explanatory context changes.

Annotations explain an alert without changing its identity

Alert labels identify which condition is being tracked and provide fields for routing and grouping. Annotations explain that condition: a current value, a concise summary, or a runbook link. Putting changing prose in labels can split one ongoing problem into many identities. Putting routing fields only in annotations can leave a route unable to recognize the alert’s intended owner. ...
February 22, 2028 · 6 min · XB Field Notes
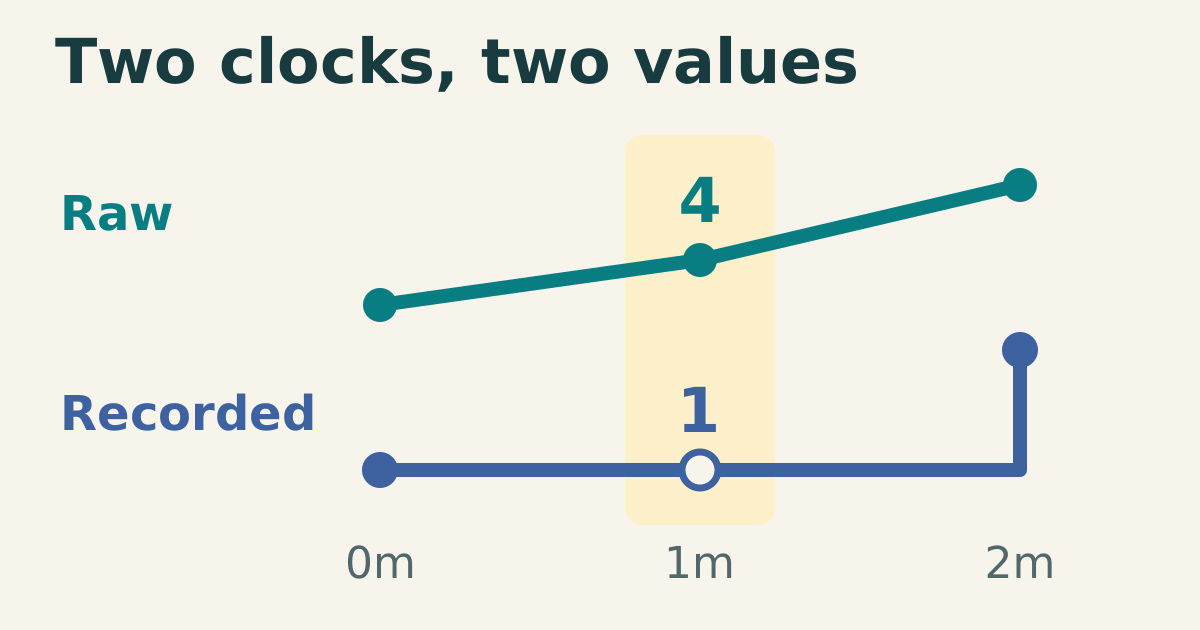
Raw values rise at minutes zero, one and two, while recorded values hold at one until the two-minute evaluation. The middle query sees raw four and recorded one.

Recording rules store scheduled query results

A recording rule runs a PromQL expression at scheduled evaluation times and stores the result as a new metric. Repeated dashboard queries can then read that metric instead of recomputing the expression. Calling this a cache can obscure an important difference: the recorded series has its own sample history, cadence, and labels. It is not a transparent cache of every possible query request. ...

January 26, 2028 · 5 min · XB Field Notes
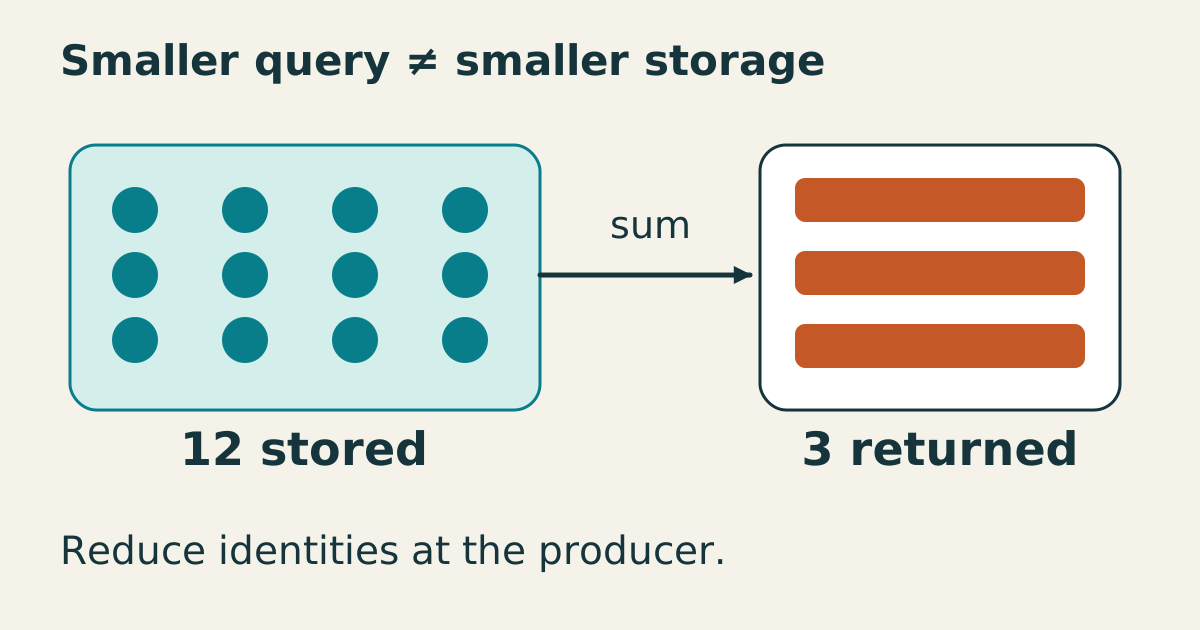
Twelve stored customer series feed three query rows; the larger input store remains in place.

High-cardinality labels increase stored series before anyone queries them

A Prometheus series is identified by a metric name and its complete label set. Adding customer or request identity to a counter can create many series even when every dashboard immediately sums those identities away. Query aggregation changes the returned result; it does not remove the raw series that were ingested. ...

January 10, 2028 · 6 min · XB Field Notes
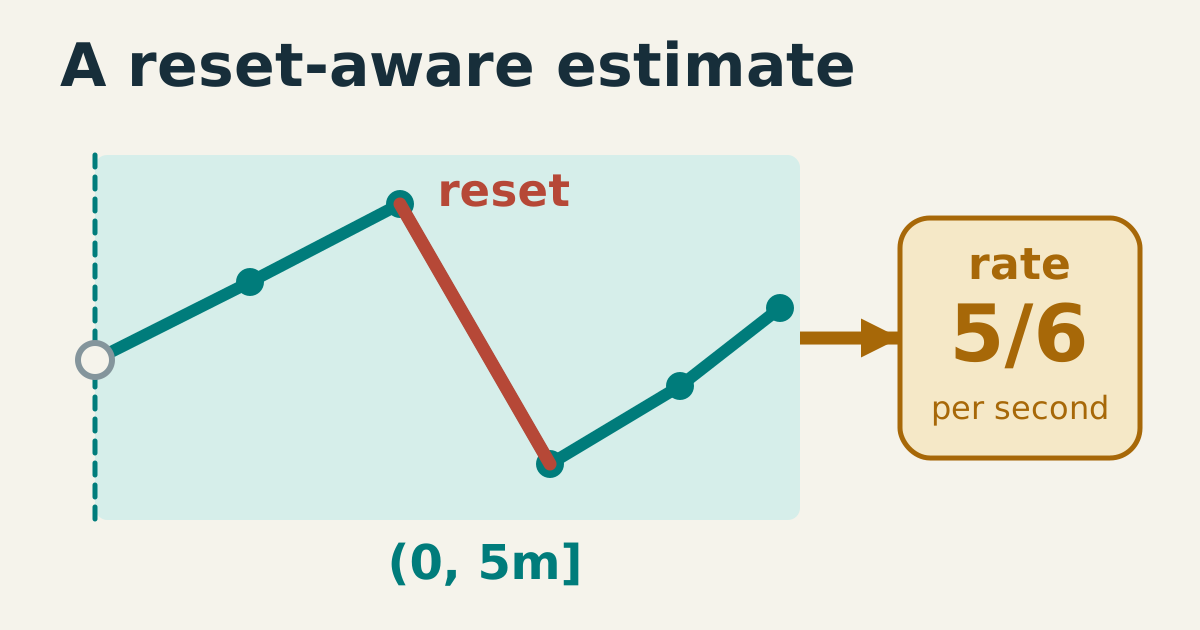
The article’s counter samples rise, reset sharply, and rise again inside a five-minute range. The first sample is outside the left-open boundary. An arrow leads from selected observations to the source fixture’s rate estimate, 5/6 per second.

Prometheus rate estimates counter growth per second

A request counter answers how many events an instrumented process has accumulated. A rate answers how quickly those events are arriving. Prometheus rate estimates average growth per second over a selected range, adjusts observed counter resets, and extrapolates toward the range boundaries. The result is useful precisely because it has a time unit, but it is not an exact reconstruction of every event between scrapes. ...

December 24, 2027 · 5 min · XB Field Notes
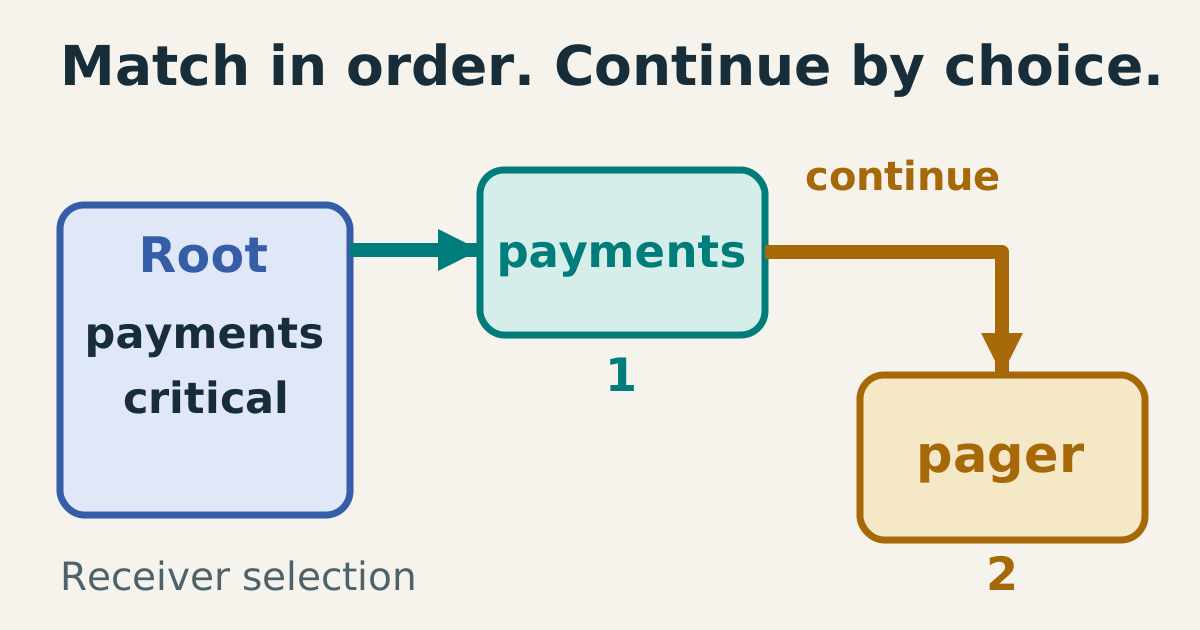
An alert labeled payments and critical enters the root. The payments match continues to the later critical match, selecting payments and pager receivers. The arrows describe ordered selection, not proven delivery.

Alertmanager routes alerts through a label-matching tree

Alertmanager selects notification receivers by walking a routing tree against an alert’s labels. The tree expresses ownership and escalation policy, while receivers describe notification integrations. A configuration can parse correctly and still send the wrong class of alert to the wrong destination. Verify the label contract and tree behavior before treating a successful reload as evidence that routing works. ...

December 8, 2027 · 5 min · XB Field Notes
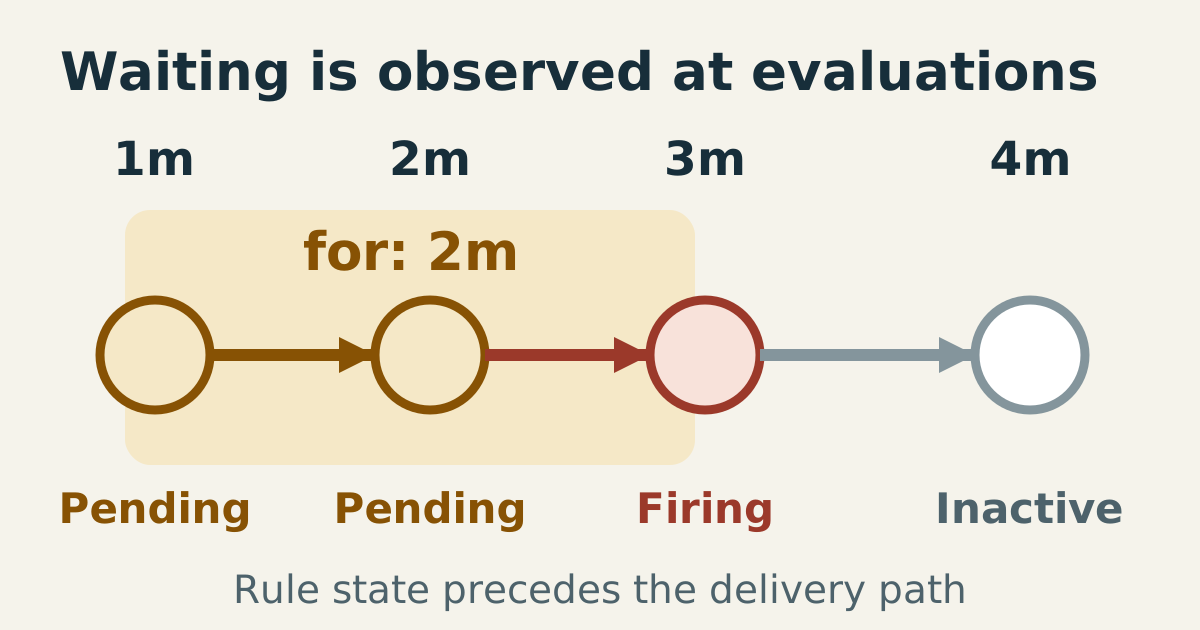
A gold pending interval begins at minute one, reaches a red firing state at minute three after two evaluated minutes, then becomes inactive at minute four. These are rule states, before notification delivery.

Prometheus rules track alert state before notification delivery

An alerting rule evaluates a PromQL expression and tracks the returned label sets over time. Prometheus decides whether each resulting alert is pending or firing. Alertmanager receives alert information and handles notification routing, grouping, silencing, and inhibition. A reliable investigation follows those stages separately: a firing alert is evidence of rule state, not proof that a person received a message. ...

September 1, 2027 · 5 min · XB Field Notes
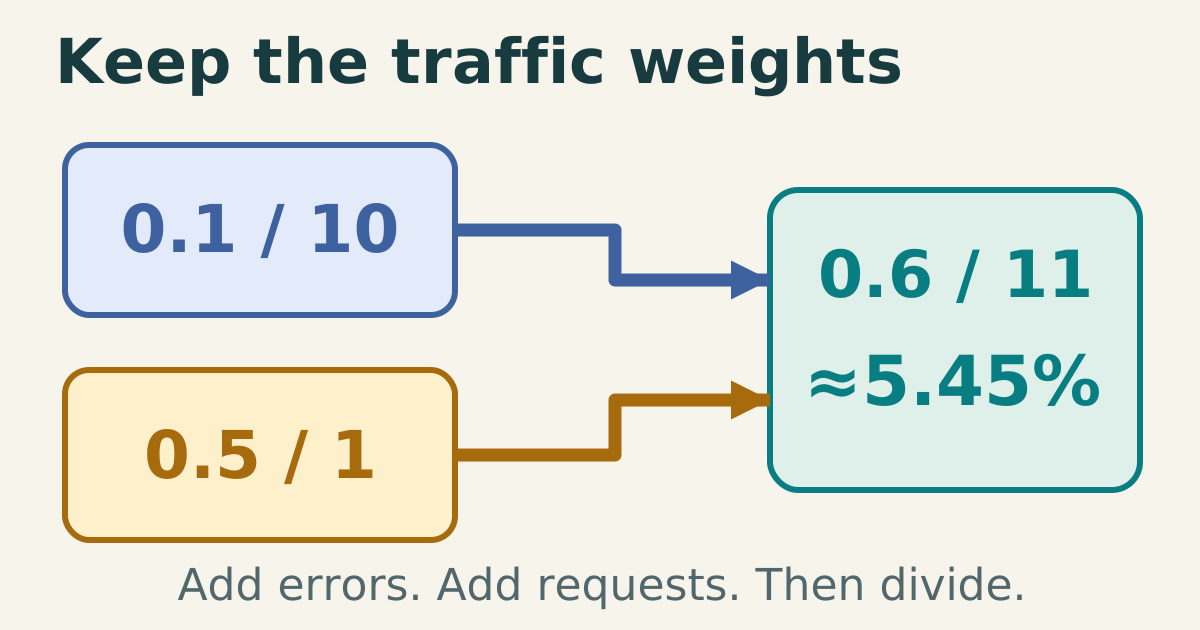
Two unequal request populations, ten requests per second and one request per second, combine their errors and requests into the weighted service fraction 0.6 divided by 11, about 5.45 percent.

Recording rules should preserve the components of a ratio

Repeated service-level queries are good candidates for recording rules when their cost and reuse justify precomputation. The design question is what to store. Saving only an instance’s error percentage can discard the traffic volume needed for later aggregation. Saving error rates and request rates preserves the numerator and denominator, allowing consumers to calculate a correctly weighted service fraction. ...

August 31, 2027 · 5 min · XB Field Notes
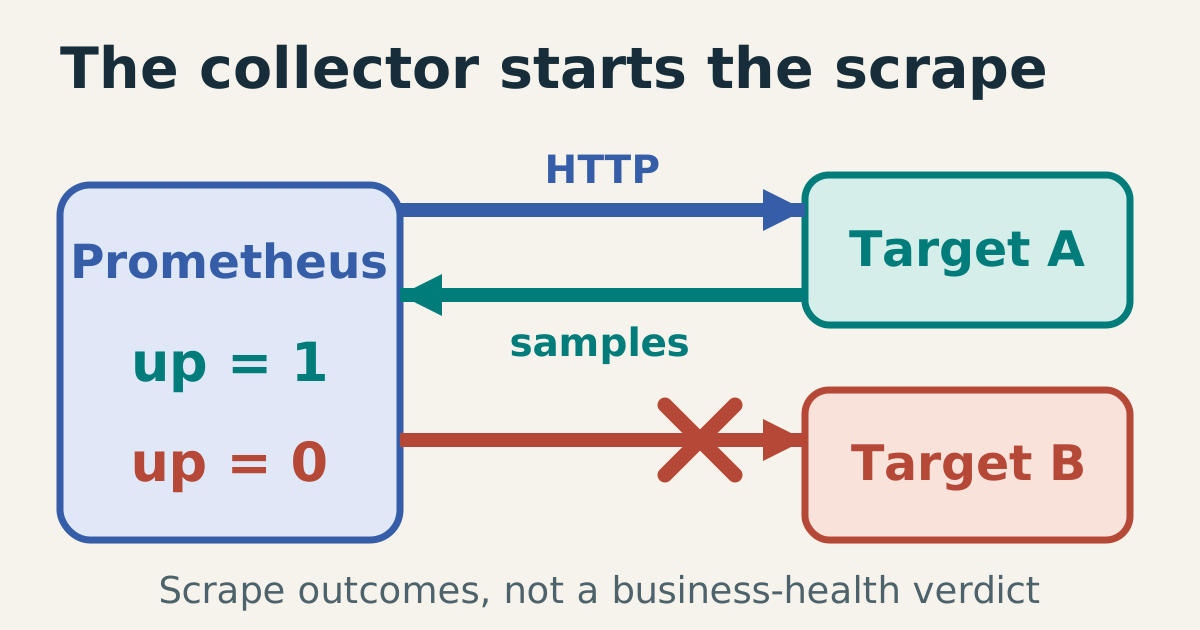
Prometheus initiates HTTP requests toward two target endpoints. A valid response returns samples and yields up=1; a refused scrape ends at a red stop and yields up=0. These are collection outcomes.

Prometheus pulls metrics and records scrape outcomes

Prometheus collects metrics by requesting an HTTP endpoint on each configured target. The target exposes observations; the collector chooses when to scrape, parses the response, and stores samples. This arrangement makes collection failures observable from the collector’s perspective. It does not guarantee that the endpoint is reachable, that every expected target was discovered, or that the application’s user journeys work. ...

August 30, 2027 · 5 min · XB Field Notes