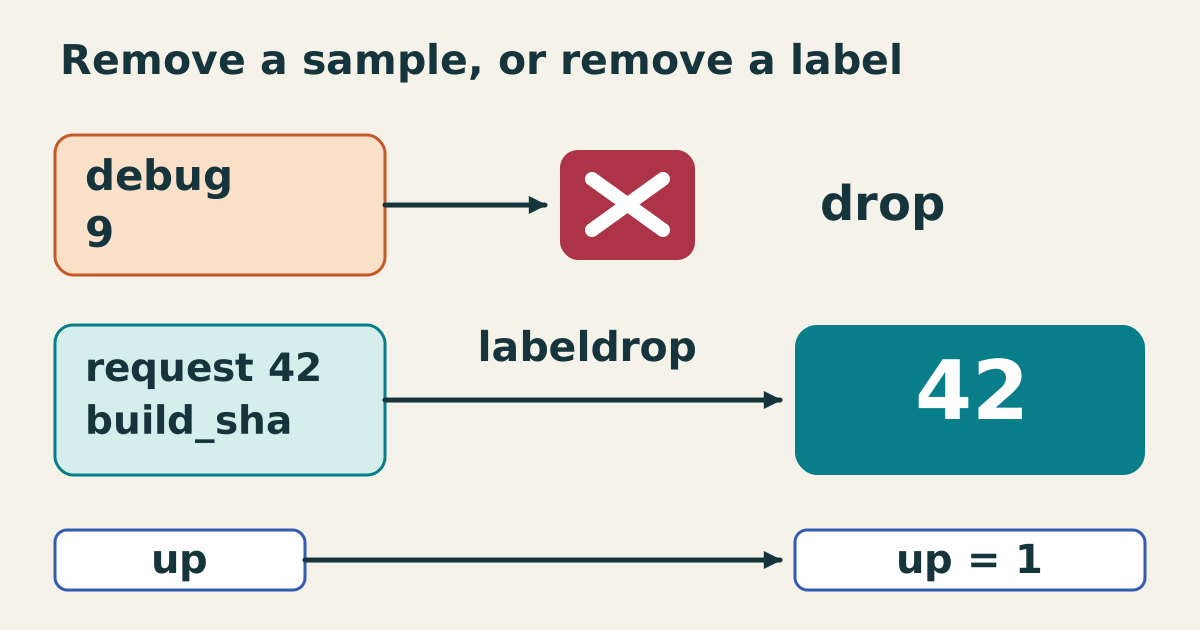
The debug sample terminates at a red drop stop. A request sample passes labeldrop with its build label removed and value 42 retained. A separate up path remains unchanged.

Metric relabeling filters samples before ingestion

Prometheus has several relabeling stages, and their similar syntax can hide different effects. Target relabeling transforms discovered targets before collection. Metric relabeling transforms scraped samples just before ingestion. A drop action at the first stage can prevent an endpoint from being scraped; the same action at the second stage discards matching samples from an endpoint that was already contacted. ...
August 4, 2027 · 6 min · XB Field Notes
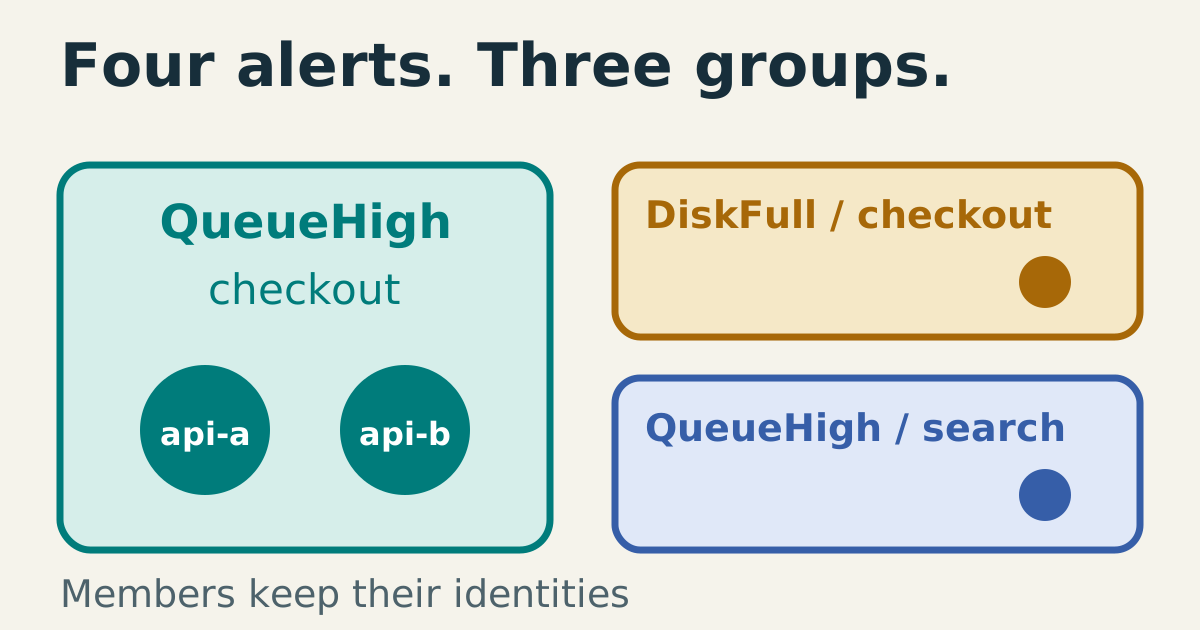
Four member dots sit inside three group boundaries: two QueueHigh checkout instances, one DiskFull checkout instance and one QueueHigh search instance. Different instance labels remain visible within the shared checkout QueueHigh group.

Alertmanager grouping batches alerts while silences suppress notifications

One incident can produce many alerts, but a group is not proof that those alerts have one cause. Alertmanager groups alerts according to configured labels and routing context so their notifications can be handled together. The original alert identities remain available inside the group. Silences add another operation: they suppress matching notifications for a time window without resolving the underlying conditions. ...

July 27, 2027 · 6 min · XB Field Notes
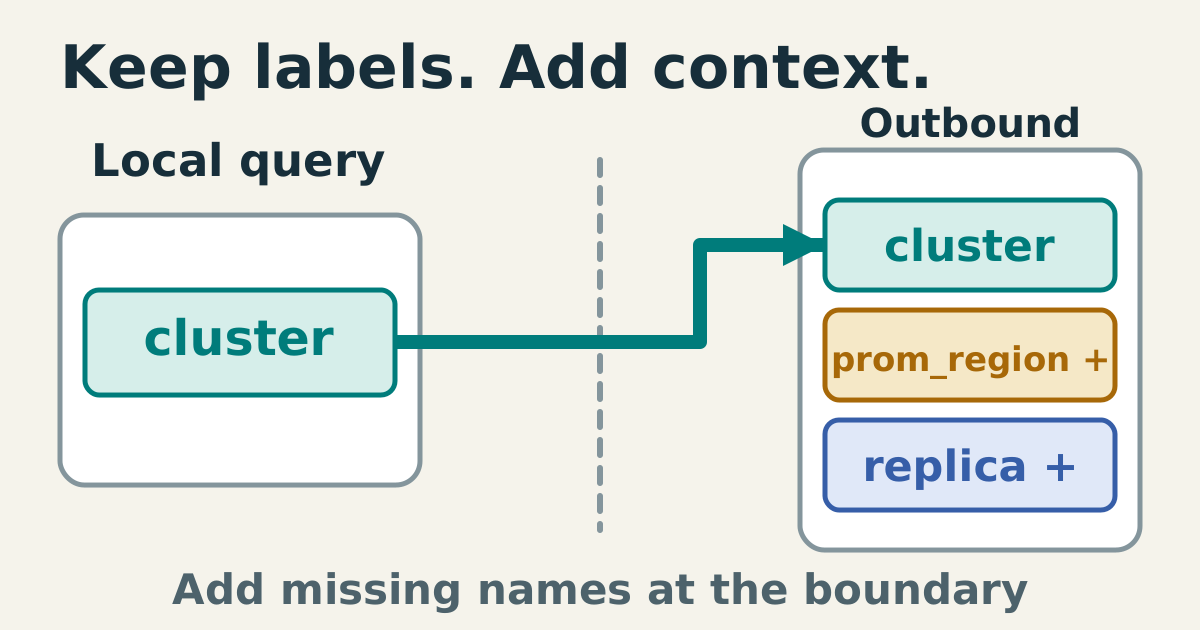
A local series with one existing cluster label crosses an outbound communication boundary. The same cluster label remains on the outgoing series while two differently colored missing-label slots are added.

External labels identify outgoing Prometheus data

When several Prometheus servers send data to a common system, downstream readers need to know which collector or environment supplied it. Global external_labels can add that context during communication with external systems. They do not rewrite every locally stored series, and they do not override labels already present on the outgoing series. Understanding both boundaries prevents misleading configuration checks. ...

June 9, 2027 · 5 min · XB Field Notes
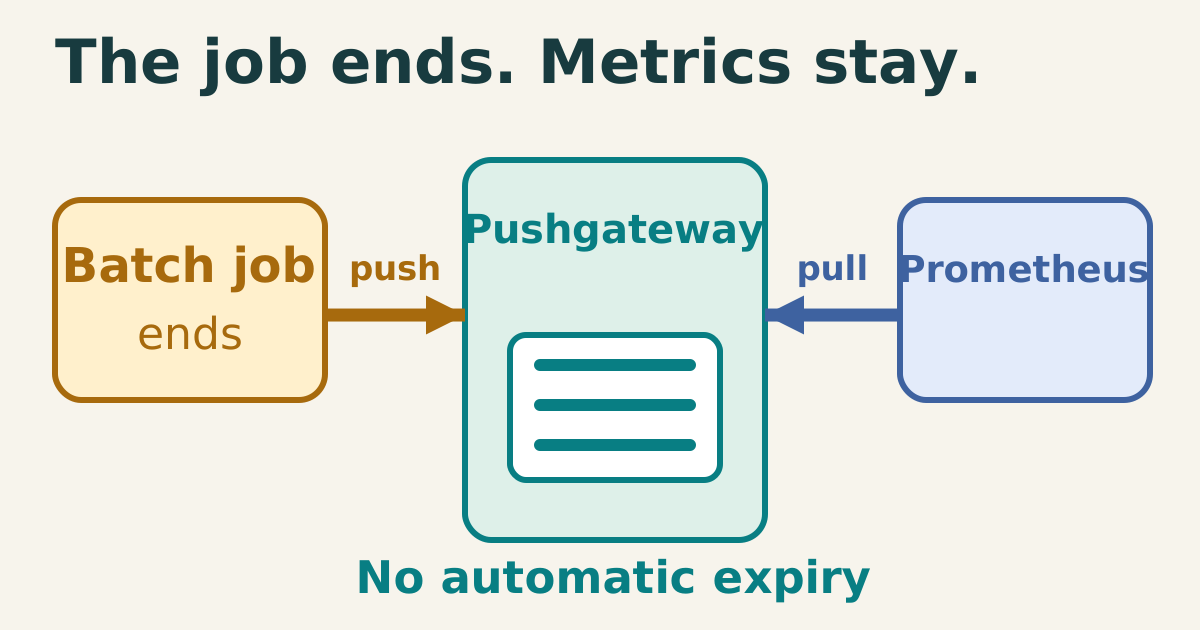
A short batch job pushes metrics into Pushgateway. Prometheus independently pulls from the gateway. A retained-data tray remains after the job ends, with explicit cleanup rather than automatic expiry.

Pushgateway retains batch metrics until their lifecycle is handled

A short-lived job can finish before Prometheus next scrapes it. Pushgateway offers an intermediary that retains pushed metrics for later scraping, but it is not the default answer for every short process. Prometheus recommends it primarily for suitable service-level batch outcomes. The retained data has a lifecycle independent of the job, so successful scraping does not prove the job recently ran or succeeded. ...

May 13, 2027 · 6 min · XB Field Notes
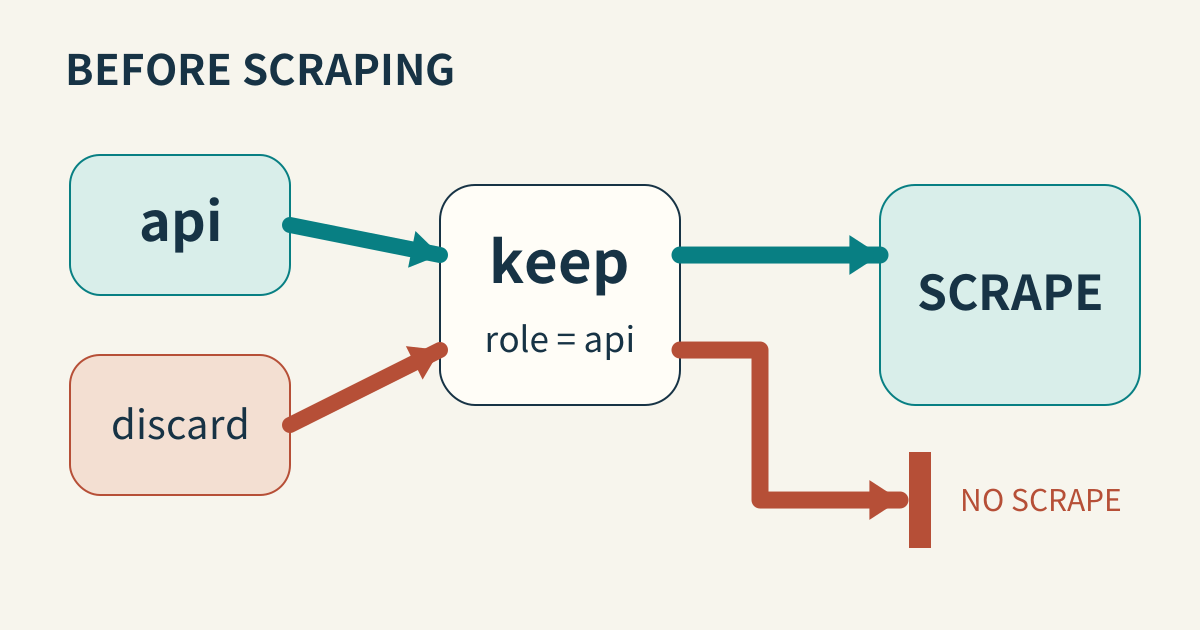
An API target passes a keep gate into scraping; the discard candidate leaves along a red branch ending at a stop bar. Selection happens before scraping.

Target relabeling selects and labels targets before scraping

Service discovery produces candidate targets and metadata. Target relabeling transforms those candidates before Prometheus scrapes them. It can keep or drop targets, change how they are addressed, and create labels carried into collected series. This is a different stage from rewriting individual scraped samples. Understanding the stage prevents a configuration intended to remove one metric from accidentally removing an entire target. ...

April 6, 2027 · 6 min · XB Field Notes
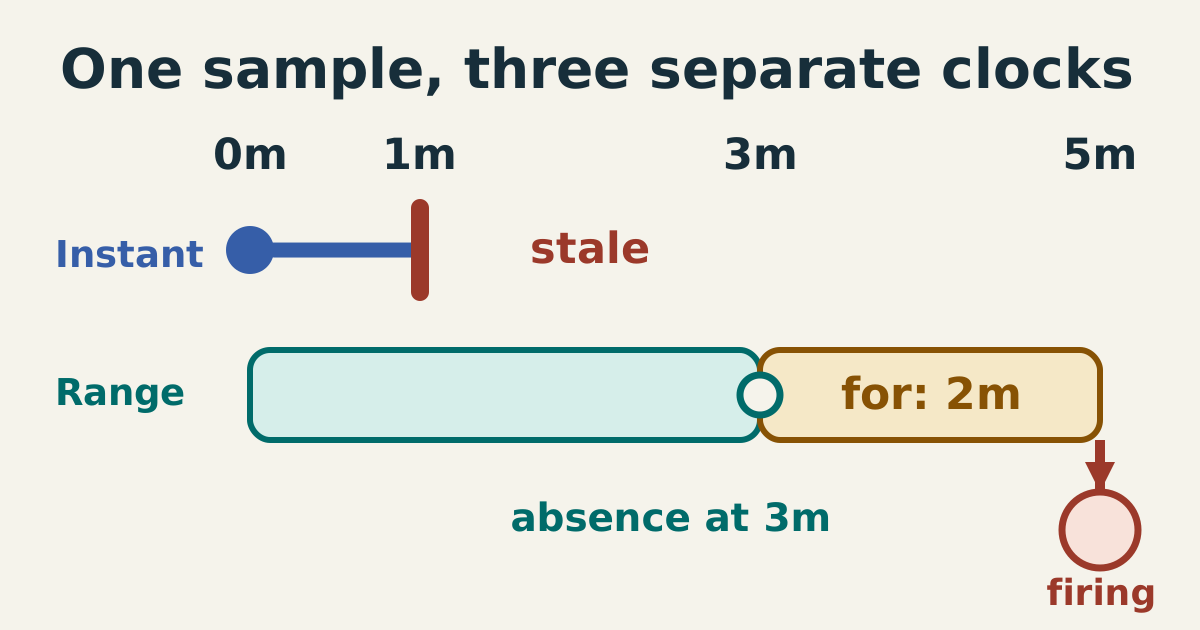
The source’s sample appears at minute zero. A stale marker stops instant selection at minute one, while the prior sample can remain in a three-minute range. Range absence begins at minute three; the separate two-minute alert wait reaches firing at minute five.

Prometheus staleness and alert waiting are different mechanisms

A missing metric is not a numeric zero. Prometheus distinguishes a series with a recent value, a series marked stale, and a selector with no usable sample. Alerting then applies its own evaluation and waiting rules. Treating all these mechanisms as one universal grace period produces alerts that miss disappearing targets or report an outage without establishing what actually disappeared. ...

February 3, 2027 · 5 min · XB Field Notes
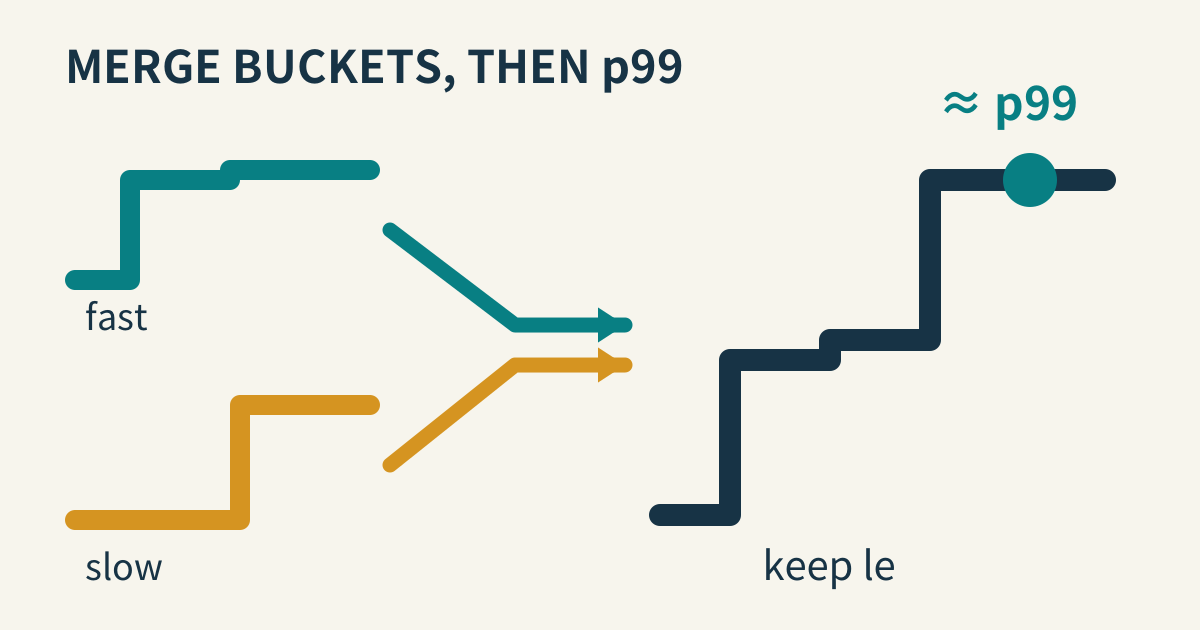
Two instance cumulative-bucket staircases merge into one fleet staircase before estimating p99. Matching le bucket identity is retained.

Prometheus histograms retain a bucketed distribution

A latency mean can conceal a slow subset of requests. A histogram retains more distribution information by counting observations into buckets, but it still discards detail within each bucket. Prometheus can estimate quantiles from those counts without storing every observation. The estimate depends on bucket boundaries and aggregation; it is not a recovery of the complete original latency distribution. ...

January 6, 2027 · 6 min · XB Field Notes
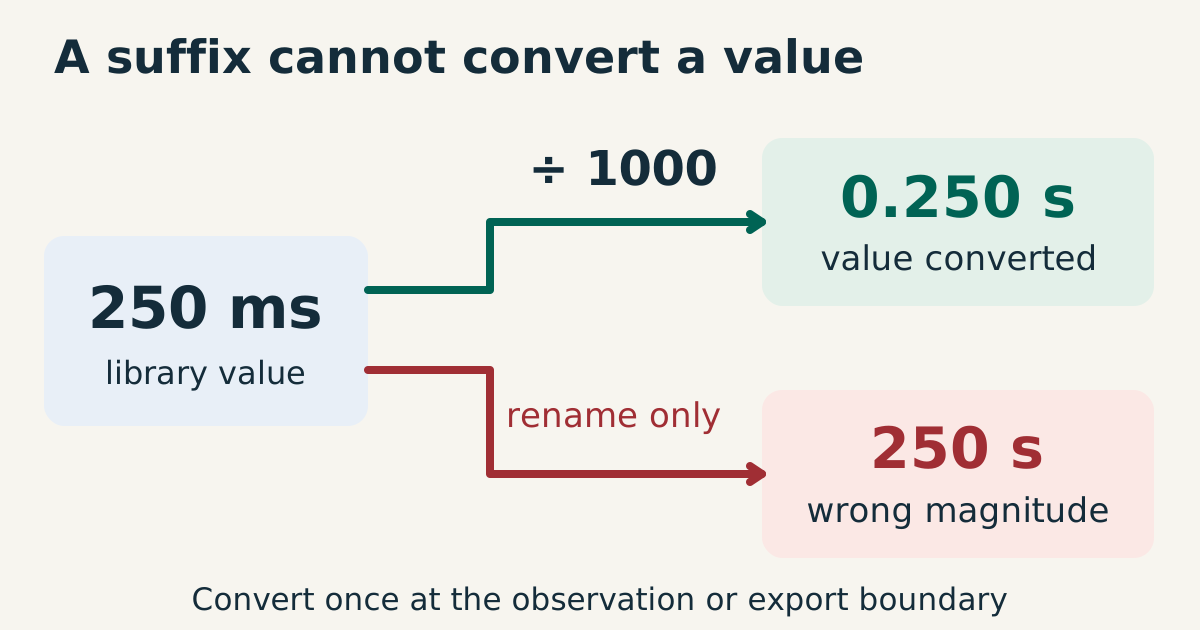
The same input, 250 milliseconds, takes two paths. Dividing by 1000 yields 0.250 seconds; changing only the suffix leaves 250, incorrectly interpreted as seconds. The upper conversion path and lower rename-only path stay visibly distinct.

Put the unit in the metric name

A metric named request_duration leaves readers guessing whether 250 means seconds, milliseconds, or something else. A Prometheus-facing name such as http_request_duration_seconds carries that contract into queries, recording rules, and alerts. The contract still needs a correct implementation. Appending _seconds to measurements collected in milliseconds changes the spelling, not the magnitude, and can create a thousandfold monitoring error. ...

October 30, 2026 · 4 min · XB Field Notes