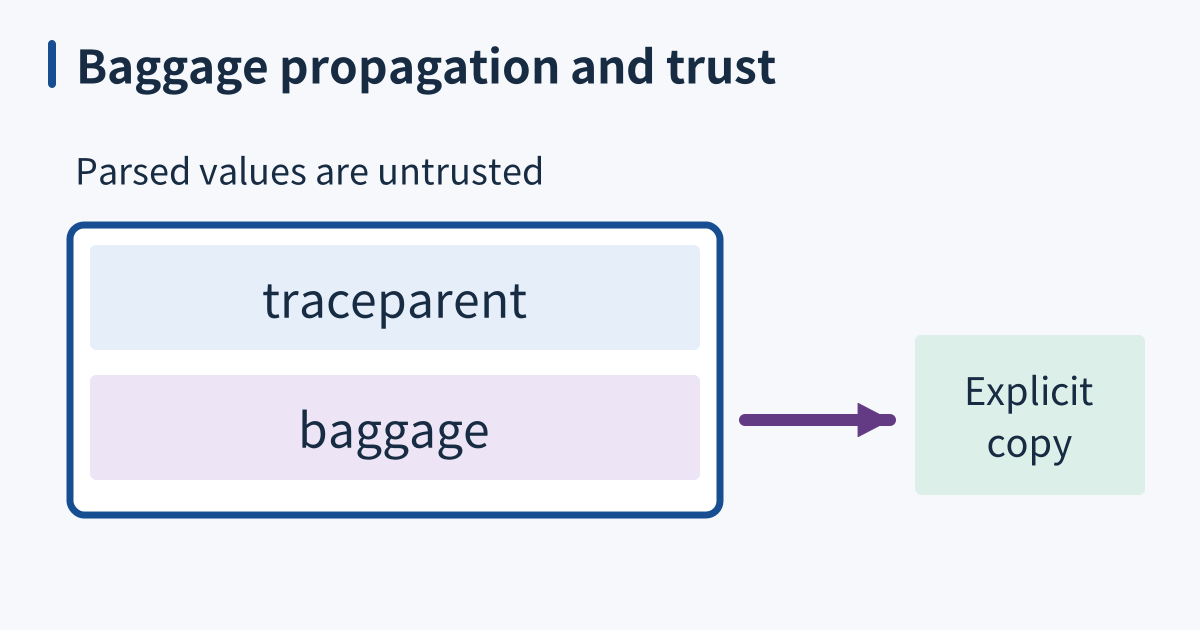
A carrier holds separate traceparent and baggage fields; baggage reaches recording only through explicit copying and remains untrusted input.

Baggage carries context across an explicit boundary

OpenTelemetry baggage is a context-associated collection of string key-value pairs. It lets information known near a request’s entry point travel to downstream operations: a deployment region or a rollout cohort, for example. Unlike a span attribute, baggage is intended for propagation. Unlike trace context, it describes application-selected information rather than the identifiers and flags connecting spans. These mechanisms can travel together without being the same data structure. ...
March 27, 2028 · 5 min · XB Field Notes
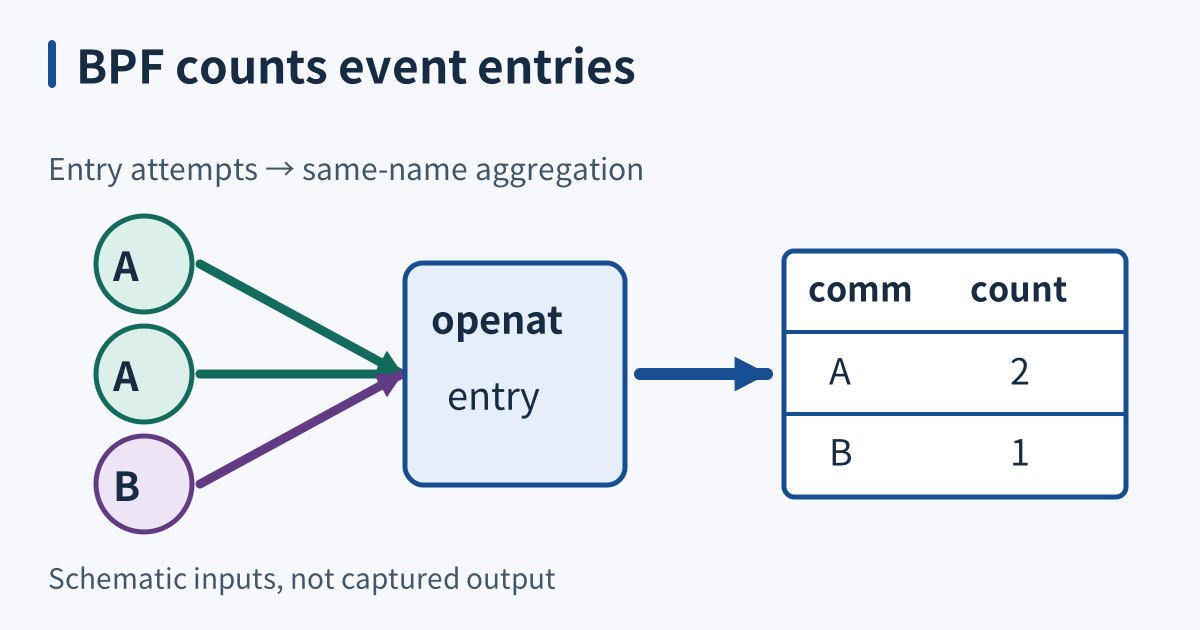
Openat entry events merge by current thread name into counts, without measuring success or latency.

BPF tracepoints peek inside the running kernel

BPF programs can attach to selected events in a running kernel without rebuilding the application or restarting its workload. A userspace loader still loads and manages the probe. Collection changes resource use, so “live” does not mean invisible or free. Other profilers can also observe running programs; choosing BPF depends on the question and available instrumentation. ...

March 6, 2028 · 5 min · XB Field Notes
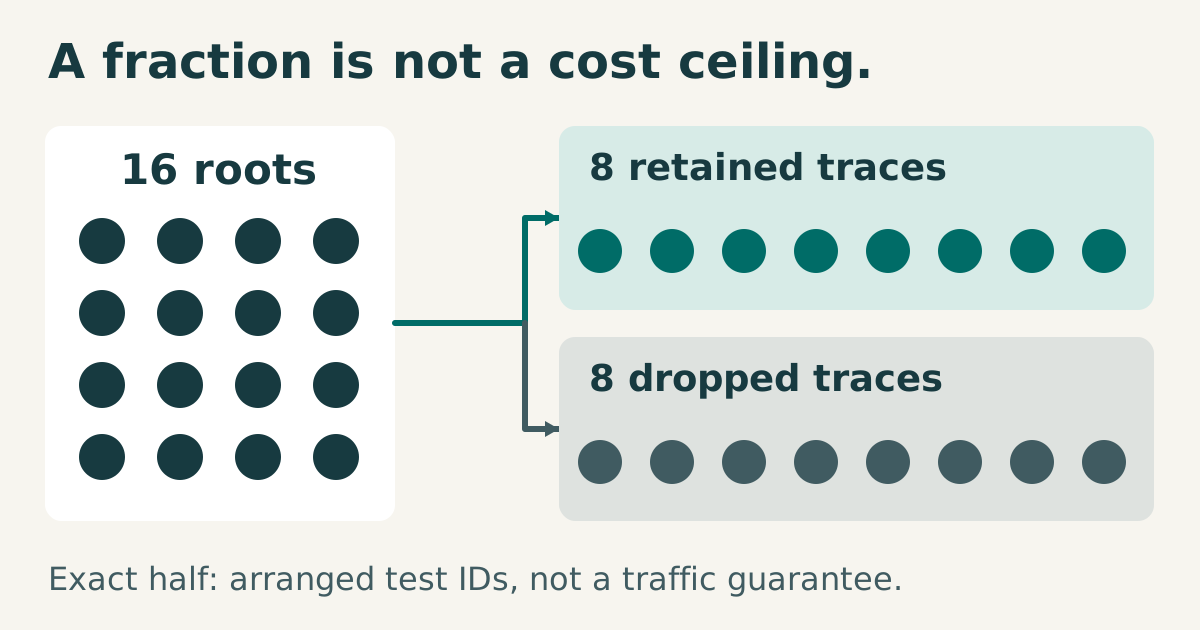
A controlled set of sixteen roots splits into eight retained traces and eight dropped traces. The sixteen-to-eight split belongs to arranged fixture identifiers; a configured sampling percentage is not a cost ceiling.

Trace sampling reduces volume without fixing a cost ceiling

Trace sampling selects which recorded work reaches the tracing pipeline. It can reduce export traffic and storage, but a configured percentage is not a strict ceiling on bytes, processor time, or money. Requests produce different numbers of spans, attributes vary in size, and traffic itself changes. A one-percent policy applied to a sudden tenfold traffic increase can still produce roughly ten times as much sampled data. ...

October 23, 2027 · 5 min · XB Field Notes
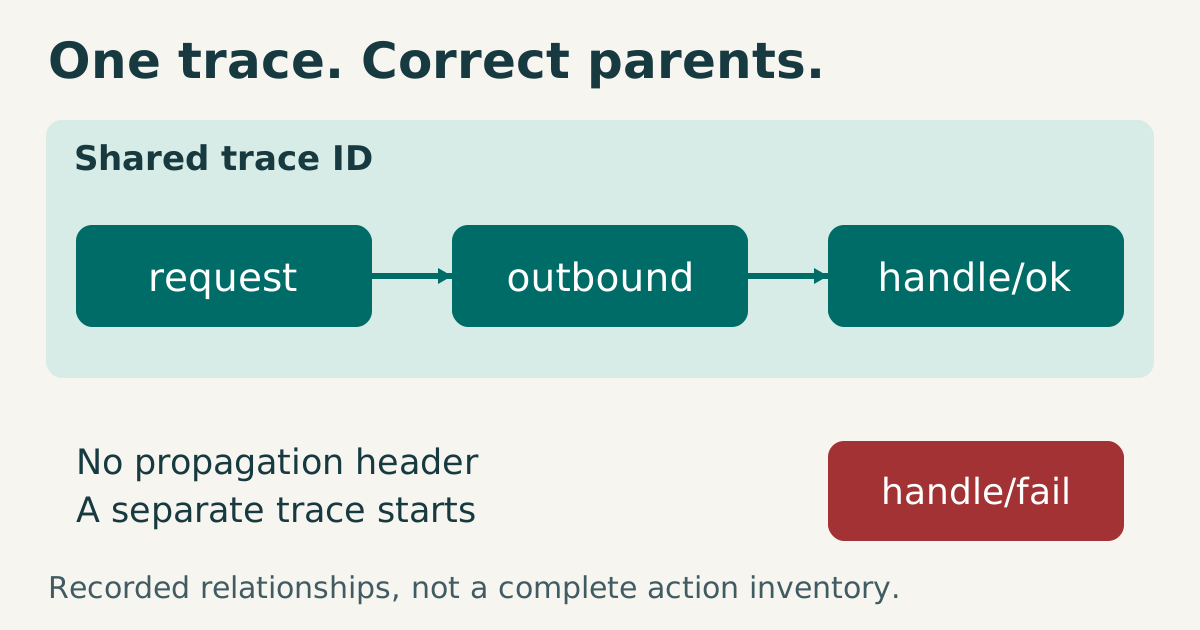
Three spans share a trace and two parent links: request, outbound, handle/ok. A second request without a propagation header starts a separate handle/fail root. Connection and failure status are different questions.

Traces connect the recorded parts of a request

A distributed trace connects recorded operations through a shared trace identifier and explicit relationships. A span represents one operation, with start and end timestamps, attributes, events, and status. This makes a trace useful when a checkout request crosses an application, an inventory service, and a payment service. The resulting picture depends on which operations were instrumented, retained, and exported; it is not an automatic inventory of every action the request performed. ...

December 15, 2026 · 5 min · XB Field Notes